Fig. 12.
Download original image
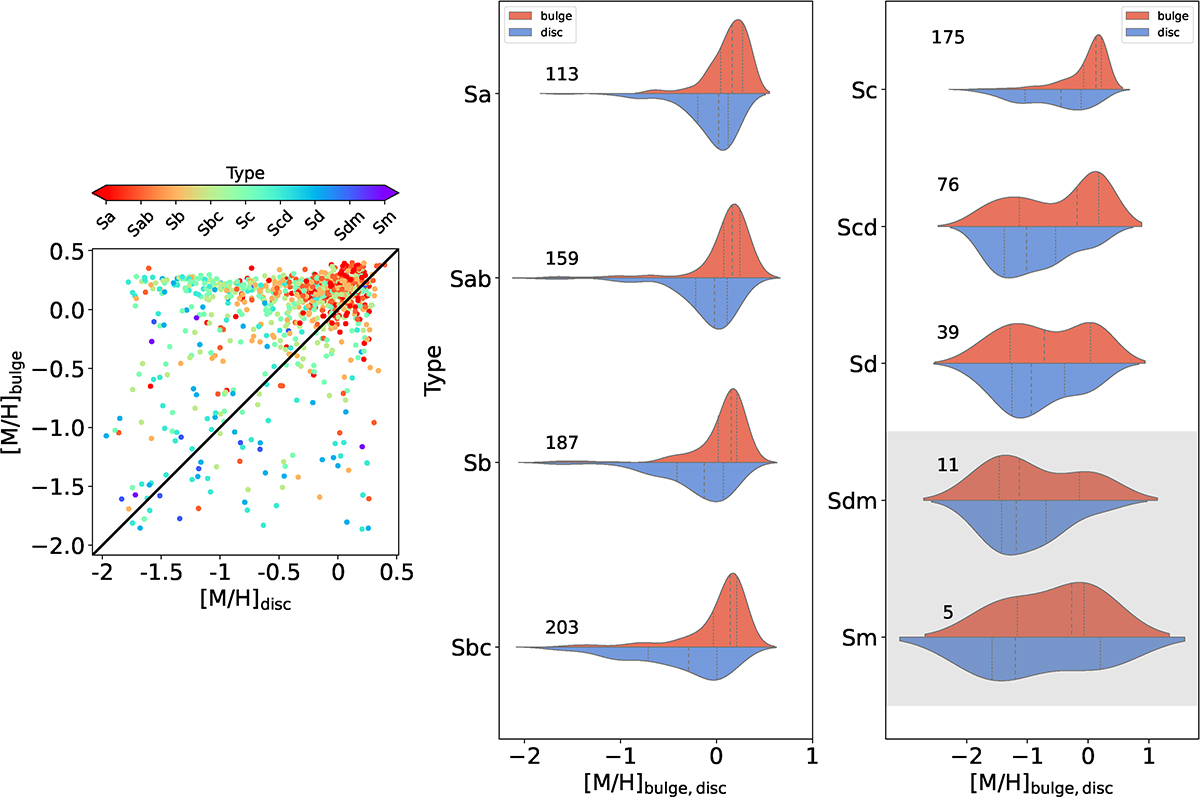
Comparison of bulge and disc metallicities and their dependence on morphology. Left panel: bulge [M/H] compared to disc [M/H], colour-coded by the morphological type. The next two columns show split violin plots, with the upper half depicting the bulge metallicity distribution (red) and the lower half depicting the disc metallicity distribution (blue) in each type. The violin plots are marked with the median by the dashed black lines, and the quartiles are shown by the dotted lines. The grey shaded regions show the morphologies with very low-number statistics.
Current usage metrics show cumulative count of Article Views (full-text article views including HTML views, PDF and ePub downloads, according to the available data) and Abstracts Views on Vision4Press platform.
Data correspond to usage on the plateform after 2015. The current usage metrics is available 48-96 hours after online publication and is updated daily on week days.
Initial download of the metrics may take a while.