Fig. 11.
Download original image
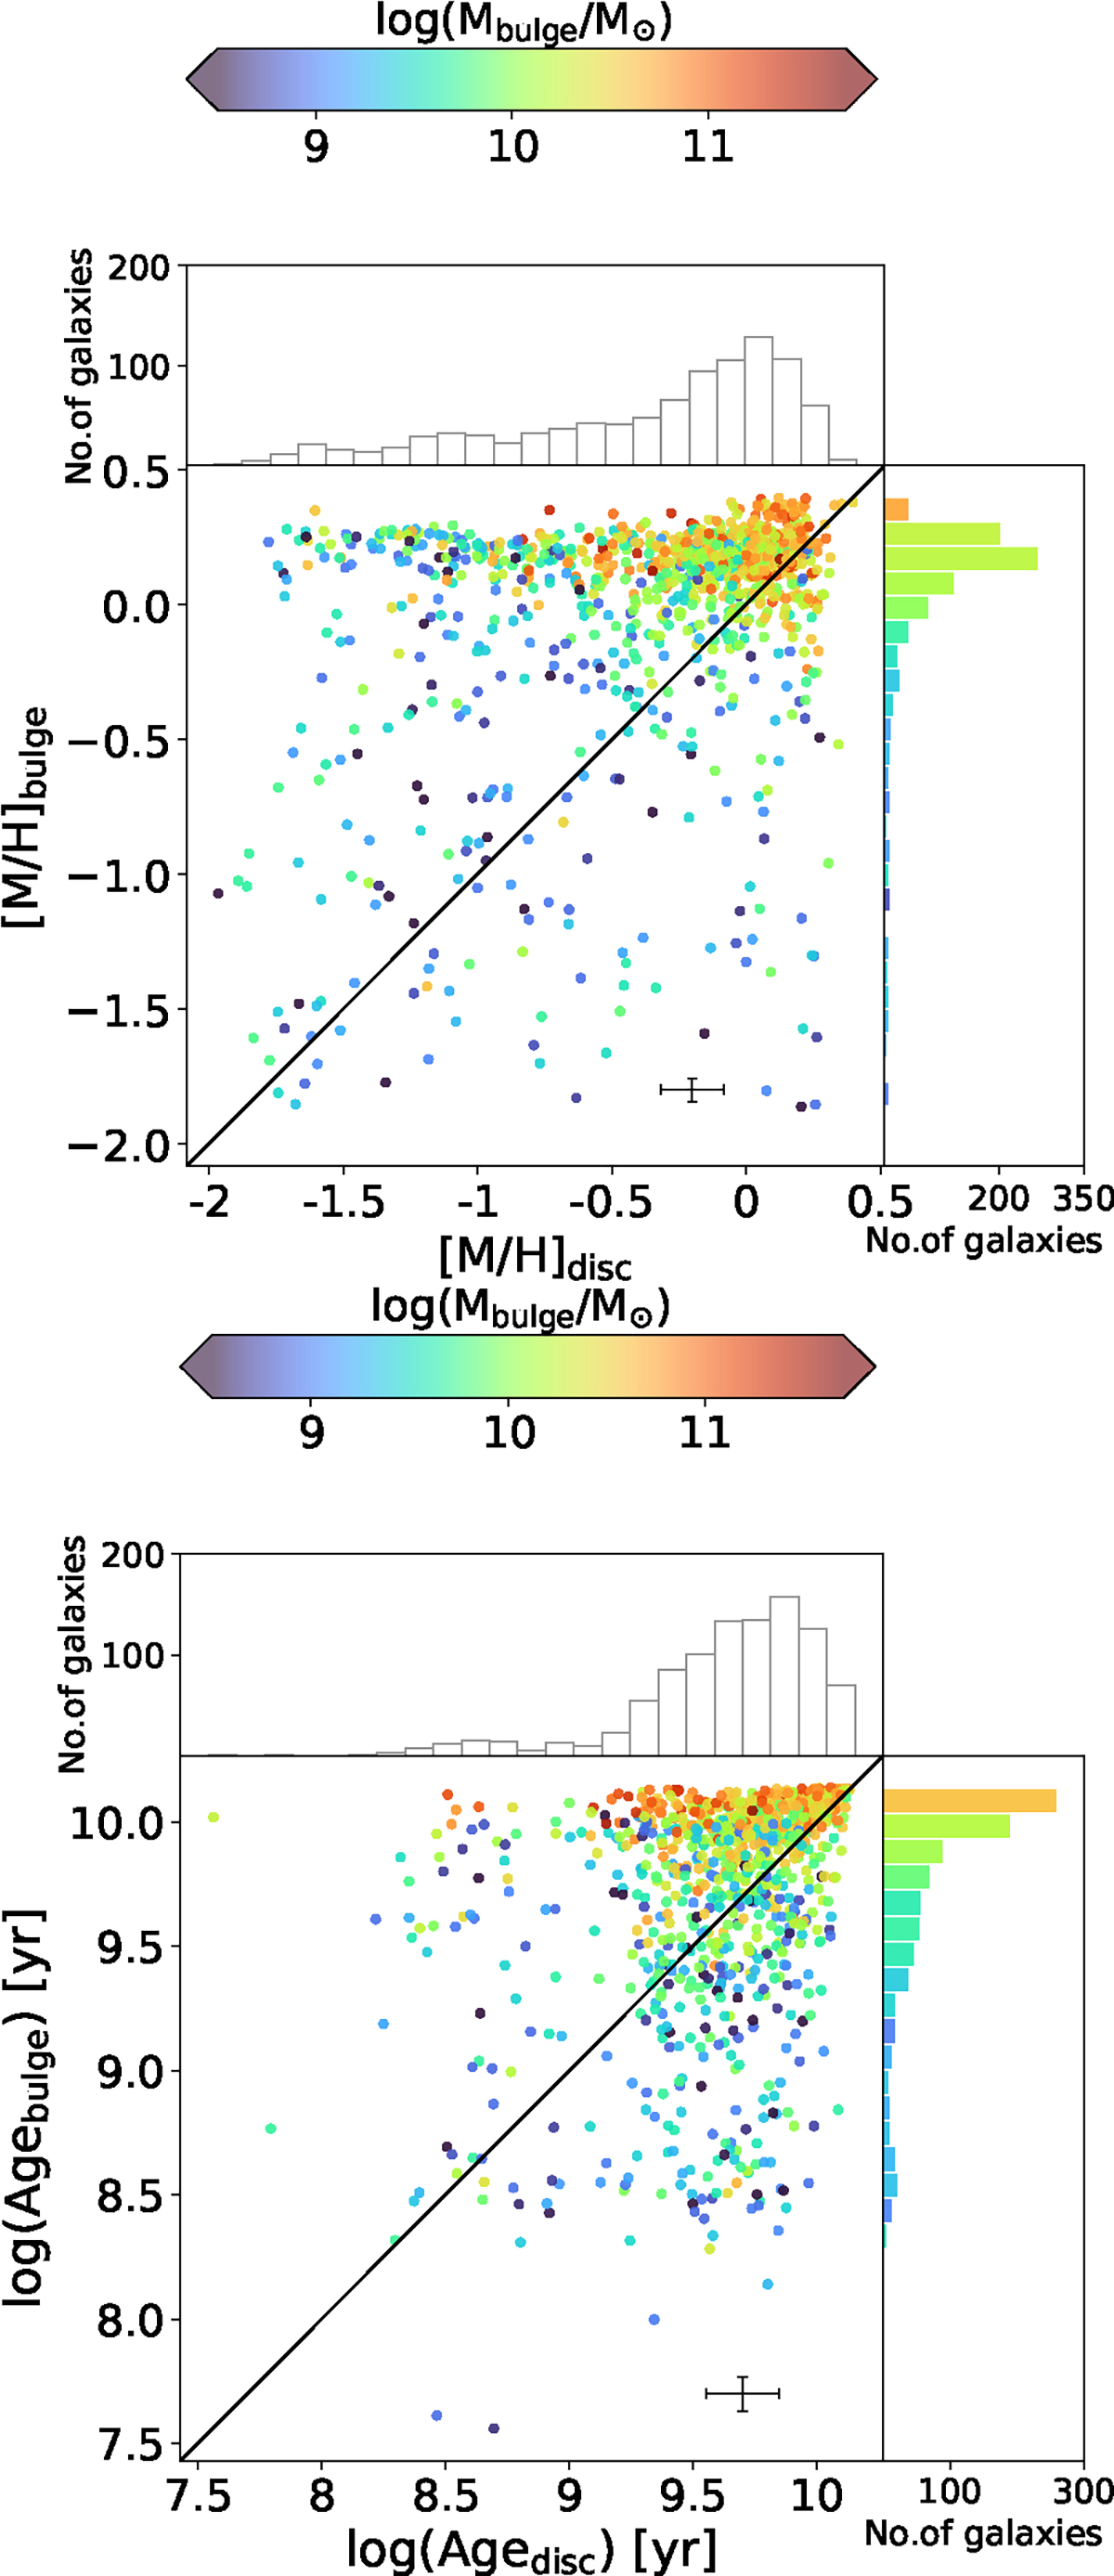
Stellar population properties of bulges and discs along with their corresponding distributions. Upper panel: comparison of mean mass-weighted stellar metallicities of the bulges and the discs, colour-coded by bulge stellar masses. The distributions in bulge (disc) metallicities are shown in the right (upper) joint histograms. Each bin in the histogram of the bulge metallicities is colour-coded by the mean bulge mass in that bin. Lower panel: the same as above, but for stellar ages.
Current usage metrics show cumulative count of Article Views (full-text article views including HTML views, PDF and ePub downloads, according to the available data) and Abstracts Views on Vision4Press platform.
Data correspond to usage on the plateform after 2015. The current usage metrics is available 48-96 hours after online publication and is updated daily on week days.
Initial download of the metrics may take a while.