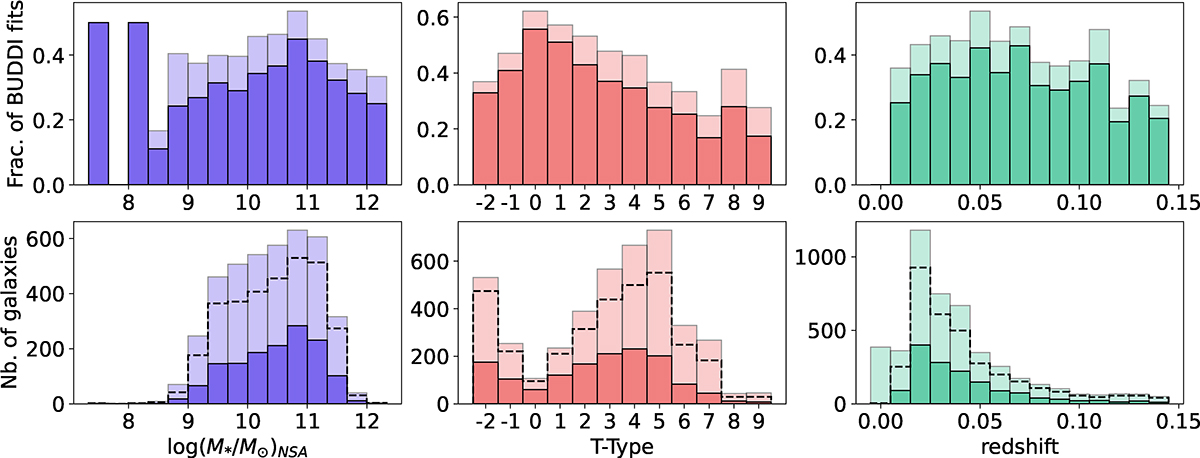
Fig. 1.
Download original image
Histograms depicting the distributions of physical properties of different samples used in this study. Lower panels: distributions of the galaxy stellar mass, morphological T-Type, and redshift in the successful fits in the new BUDDI-MaNGA DR17 sample, as defined in Sect. 3.3 (darker shades), and for all the MaNGA galaxies observed with the 91 and 127 fibre IFUs (lighter shades). The dashed outlines depict the distributions of the galaxies that were successfully fit with PYMORPH in the MPP-VAC-DR17, which determined the initial set of objects from which we built the BUDDI-MaNGA sample. The T-Types of the ellipticals and S0s from the VAC are reassigned indices of −2 and −1, respectively, for continuity in the distribution. Upper panels: distributions of the fraction of successful BUDDI fits with respect to the PYMORPH fits sample (lighter shades), and a fraction of successful BUDDI fits with respect to the MaNGA sample with the largest IFUs (darker shades).
Current usage metrics show cumulative count of Article Views (full-text article views including HTML views, PDF and ePub downloads, according to the available data) and Abstracts Views on Vision4Press platform.
Data correspond to usage on the plateform after 2015. The current usage metrics is available 48-96 hours after online publication and is updated daily on week days.
Initial download of the metrics may take a while.