Fig. 9
Download original image
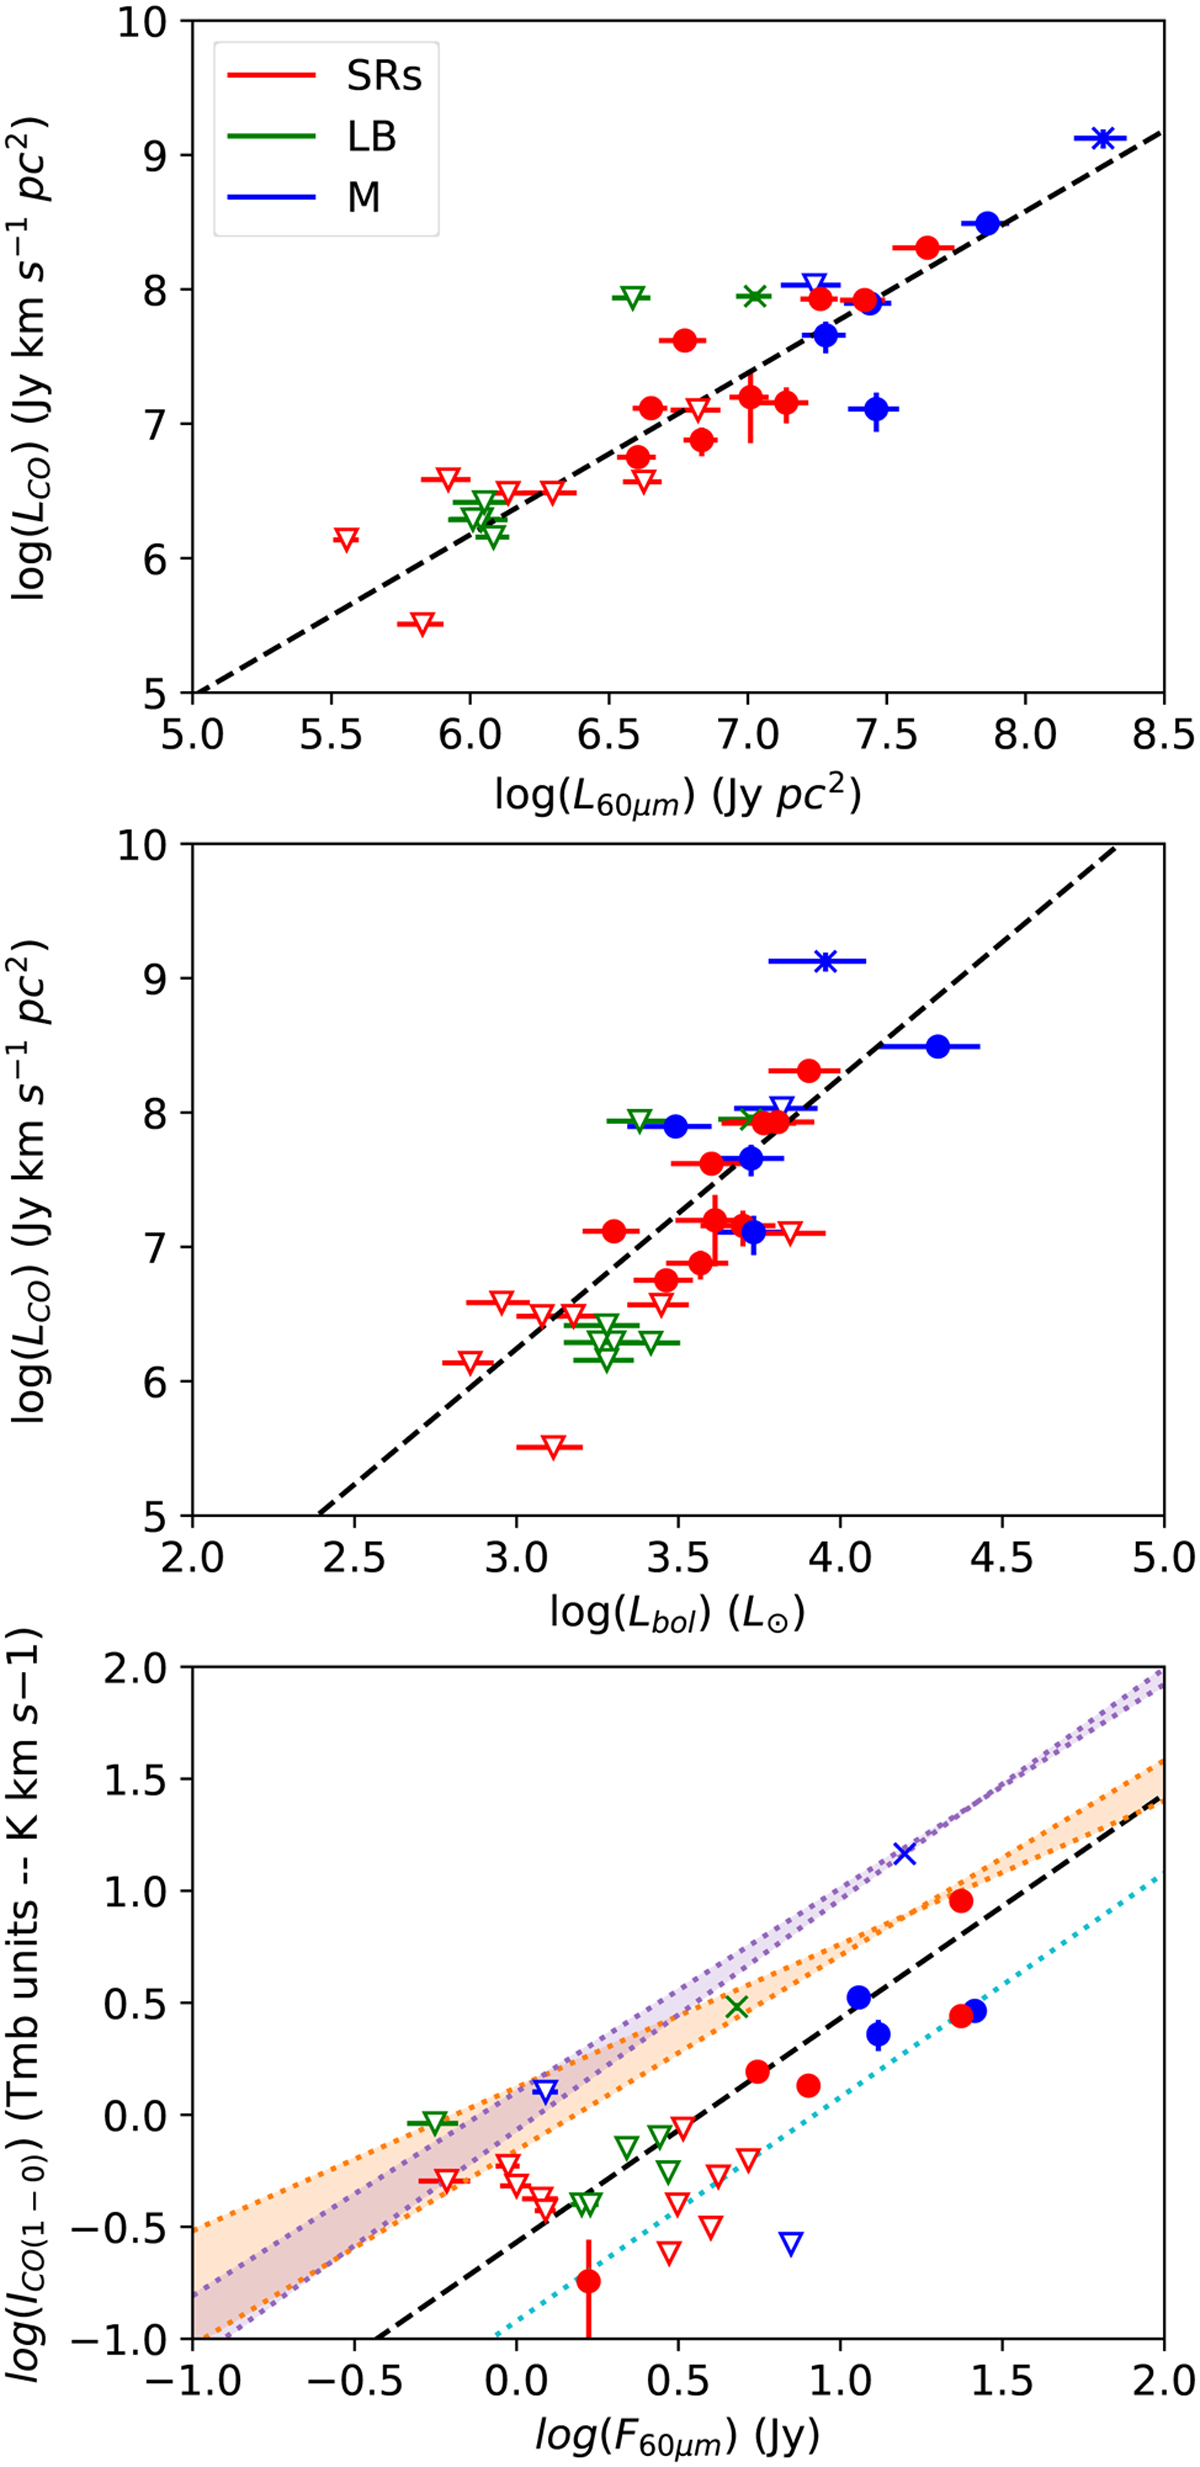
Comparisons of the CO integrated intensity, IRAS 60 µm emission, and bolometric luminosity (Tables B.1 and 2). In the upper and middle panels LCO is compared with L60 µm and Lbol. In the lower panel the 12CO (J = 1−0) main-beam brightness temperature (TMB) is plotted against the IRAS 60 µm flux after properly scaling TMB when observed with a telescope other than the IRAM-30 m antenna (see 7.1). The dashed line is the best linear fit to our data; the dotted lines are linear correlations from Nyman et al. (1992) and Bujarrabal et al. (1992) for O-rich AGBs (orange), C-rich AGBs (purple), and pre-PNe (cyan). The colours and shapes of the markers are the same as in Fig. 7.
Current usage metrics show cumulative count of Article Views (full-text article views including HTML views, PDF and ePub downloads, according to the available data) and Abstracts Views on Vision4Press platform.
Data correspond to usage on the plateform after 2015. The current usage metrics is available 48-96 hours after online publication and is updated daily on week days.
Initial download of the metrics may take a while.