Fig. 7
Download original image
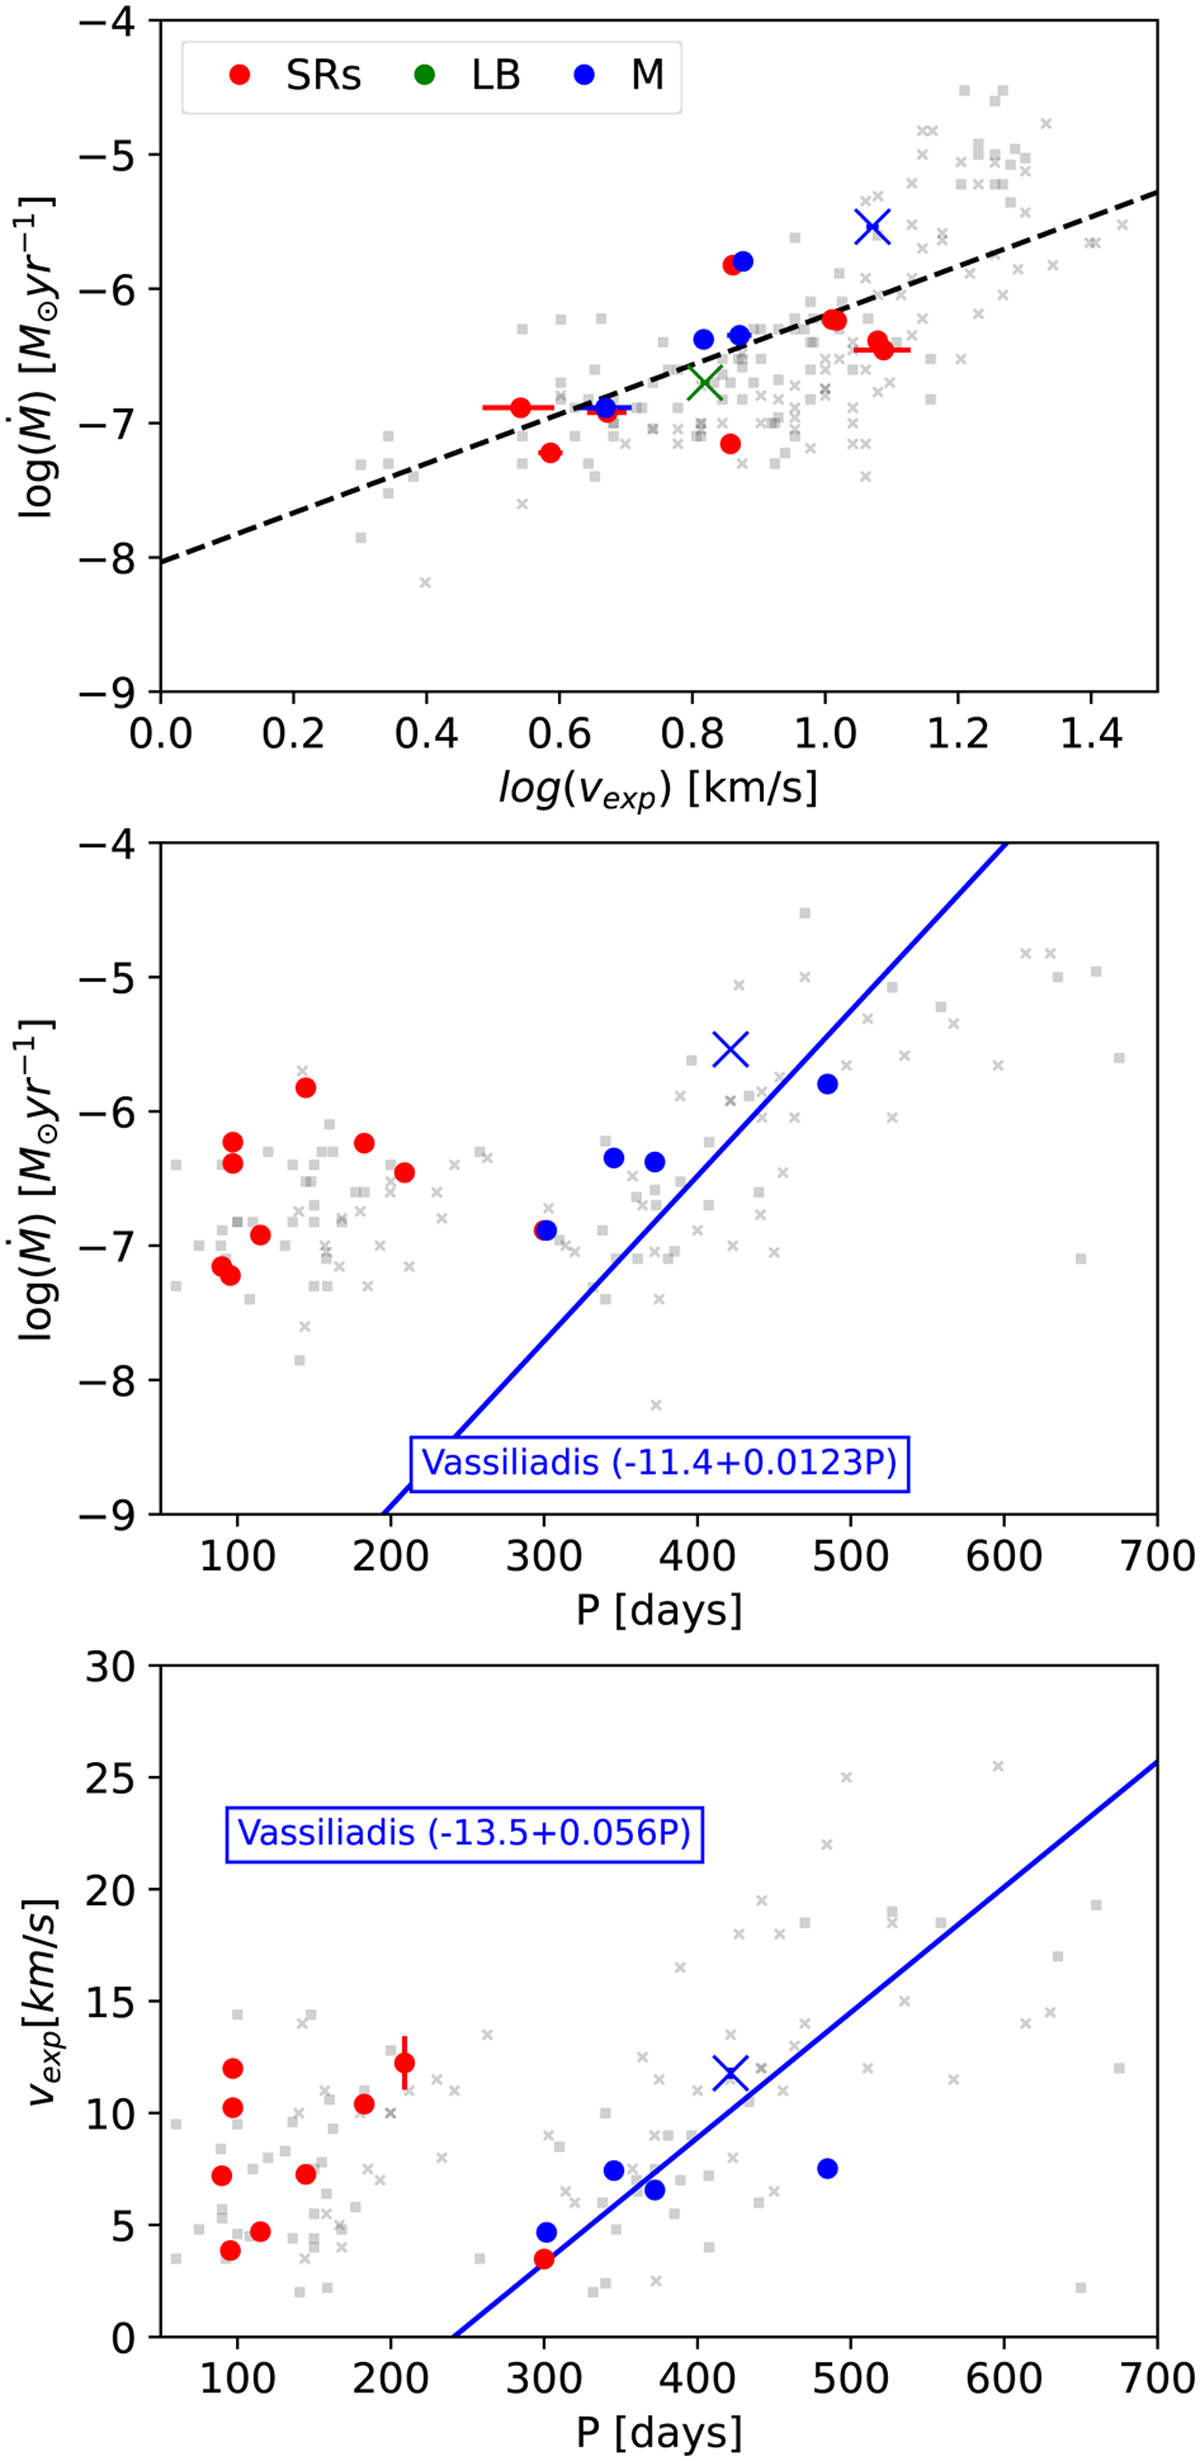
Comparison between some fundamental parameters of the AGBs envelopes (Ṁ, Vexp and P) and with well-known correlations found in the literature. Upper: Relationship between Ṁ and Vexp. Centre: Relationship between Ṁ and P. Lower: Relationship between Vexp and P. The colours of the markers represent the variability type. Red: semi-irregulars (SRs), green: irregulars (LB), and blue: Miras (M). The dashed line represents the linear fit performed over our sample and the solid lines represent the linear relationships for Ṁ and Vexp with P found for Mira AGBs from Vassiliadis & Wood (1993). Grey markers represent AGB stars with Ṁ and Vexp values recompiled by Van de Sande et al. (2021). The shape of the markers represents the chemistry type in the two samples: circles for O-rich AGB stars and crosses for C-rich AGB stars.
Current usage metrics show cumulative count of Article Views (full-text article views including HTML views, PDF and ePub downloads, according to the available data) and Abstracts Views on Vision4Press platform.
Data correspond to usage on the plateform after 2015. The current usage metrics is available 48-96 hours after online publication and is updated daily on week days.
Initial download of the metrics may take a while.