Fig. 5
Download original image
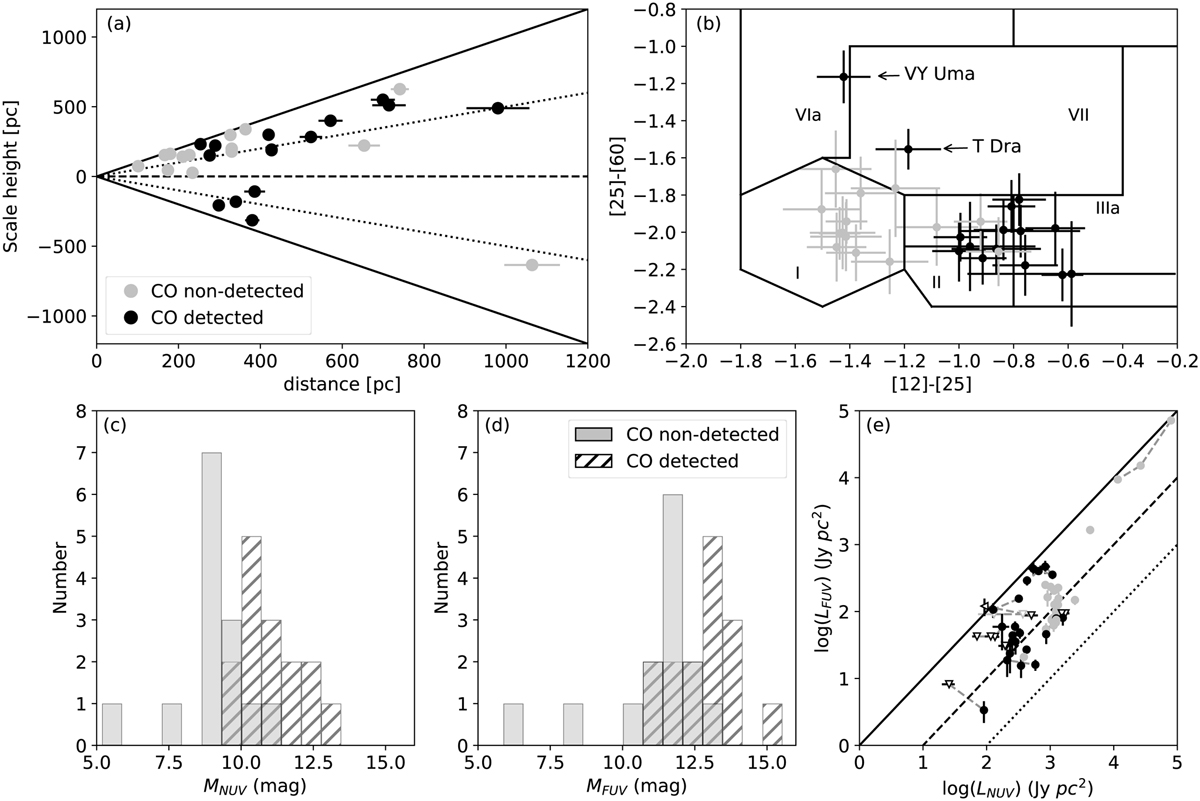
Comparison between different parameters and the 12CO detectability of our targets. (a) Scale height vs. distance for our targets. The solid line represents a viewing angle of ±90°, the dotted line represents a viewing angle of ±30°, and the dashed line represents a viewing angle of 0°. The non-detected in 12CO are shown as red circles, sources detected in 12CO (J = 2−1) line are shown as green squares, and sources detected in both 12CO lines are shown as blue stars. (b) IRAS [25]-[60] vs. [12]-[25] two-colour diagram restricted to those regions in which our sources are located (i.e. regions I, II, IIIa, VIa, and VII). The colour scheme is the same as (a). (c) Histogram with the distribution of the NUV magnitudes of our sample. The sources detected in 12CO are shown in white and sources non-detected in 12CO are shown in grey. (d) Same as (c) for FUV magnitudes. (e) Comparison between NUV and FUV luminosities. The solid line represents the relation RFUV/NUV = 1, the dashed line represents the relation RFUV/NUV = 0.1, and the dotted line represents the relation RFUV/NUV = 0.01. Solid circles correspond to well measured luminosities and empty triangles to upper limits in one of the luminosities; the colour scheme is the same as (a).
Current usage metrics show cumulative count of Article Views (full-text article views including HTML views, PDF and ePub downloads, according to the available data) and Abstracts Views on Vision4Press platform.
Data correspond to usage on the plateform after 2015. The current usage metrics is available 48-96 hours after online publication and is updated daily on week days.
Initial download of the metrics may take a while.