Fig. 2
Download original image
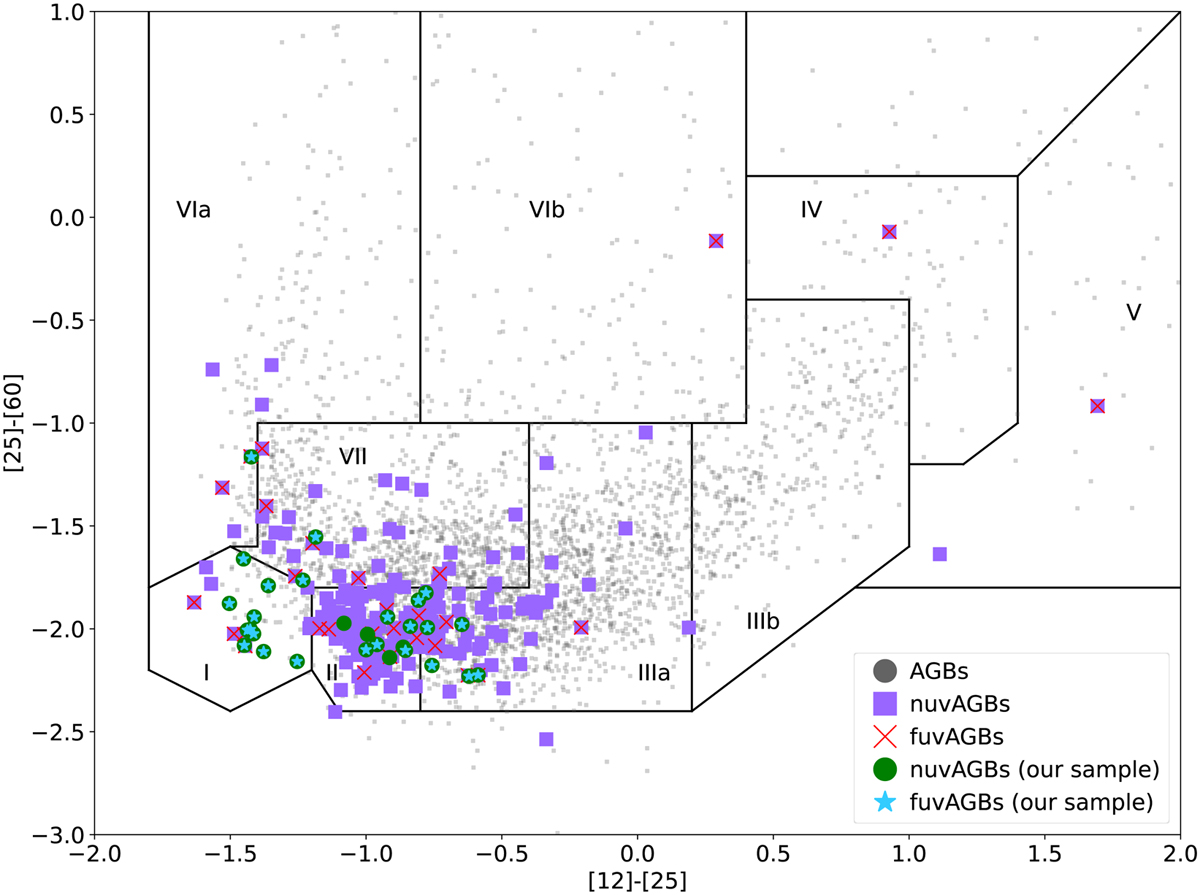
IRAS [25]-[60] vs. [12]-[25] colour-colour diagram showing the location of our sample of 29 uvAGBs and the AGB stars (with and without UV excess) from the catalogue by Suh (2021), see Sect. 2. The colours of the markers represent the NUV-FUV emission; the sample is indicated in the bottom right corner for reference.
Current usage metrics show cumulative count of Article Views (full-text article views including HTML views, PDF and ePub downloads, according to the available data) and Abstracts Views on Vision4Press platform.
Data correspond to usage on the plateform after 2015. The current usage metrics is available 48-96 hours after online publication and is updated daily on week days.
Initial download of the metrics may take a while.