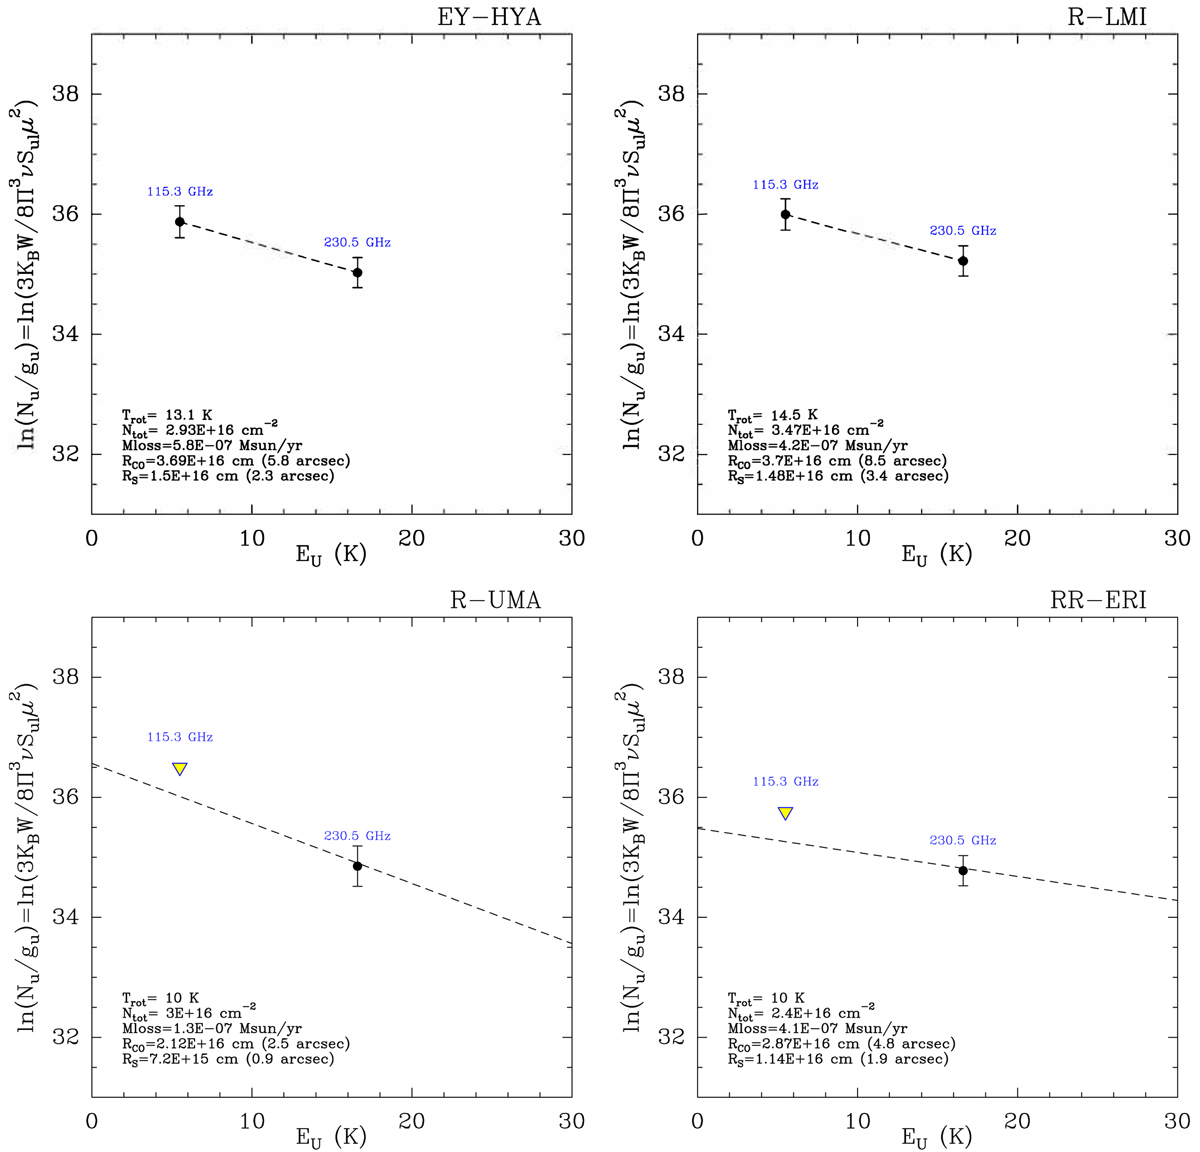
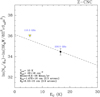
Fig. E.1
Download original image
Opacity-corrected population diagrams for uv AGB stars with CO detections (see Appendix E). Upper limits (3σ) for 12CO (J = 1−0) non-detections are indicated by triangles. Values of the main envelope parameters deduced from the fits (dashed line) are indicated in the bottom left corner of the boxes.
This figure is made of several images, please see below:
Current usage metrics show cumulative count of Article Views (full-text article views including HTML views, PDF and ePub downloads, according to the available data) and Abstracts Views on Vision4Press platform.
Data correspond to usage on the plateform after 2015. The current usage metrics is available 48-96 hours after online publication and is updated daily on week days.
Initial download of the metrics may take a while.