Fig. D.1
Download original image
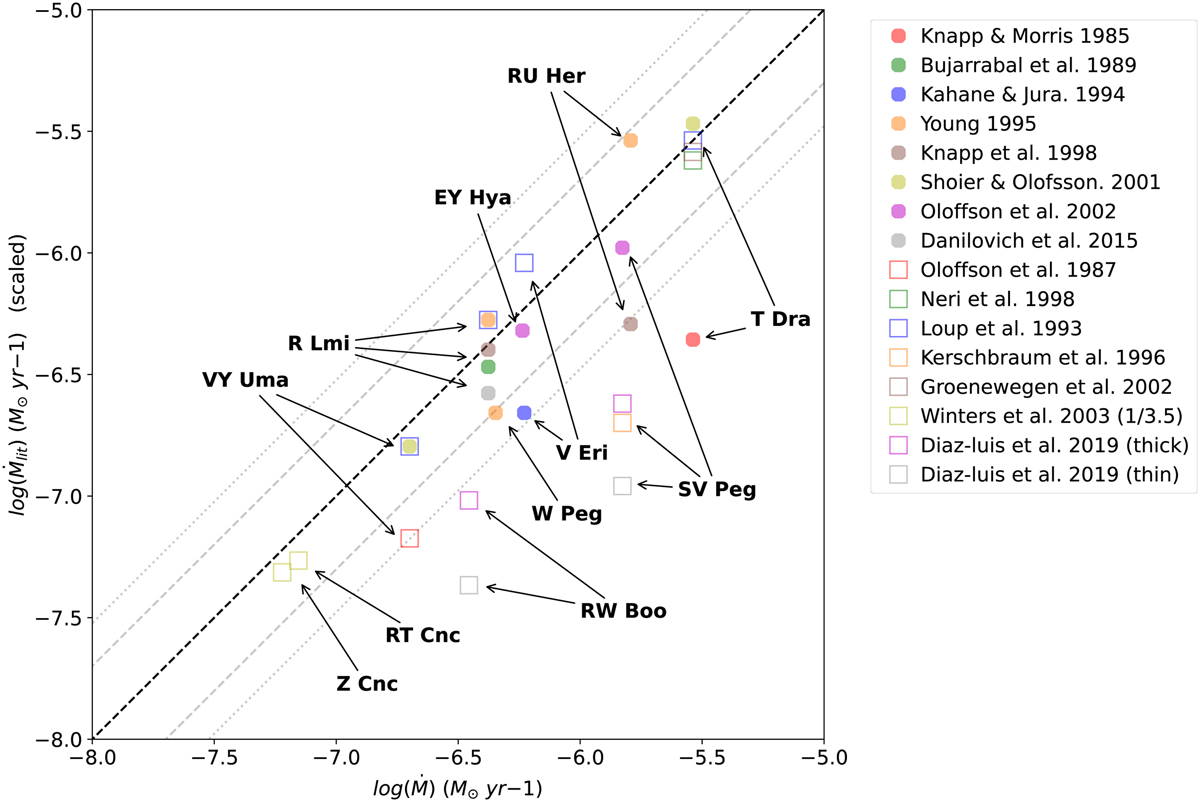
Comparison between mass-loss rates scaled values from the literature (Ṁlit) and Ṁ obtained in this work fitted with Rs = RCO/2.5. The solid line indicates equality, the dashed lines relationships 1/2 and 2, and the dotted lines relationships 1/3 and 3. Filled circles and empty squares indicate previous studies with radiative transfer models and with empirical laws, respectively.
Current usage metrics show cumulative count of Article Views (full-text article views including HTML views, PDF and ePub downloads, according to the available data) and Abstracts Views on Vision4Press platform.
Data correspond to usage on the plateform after 2015. The current usage metrics is available 48-96 hours after online publication and is updated daily on week days.
Initial download of the metrics may take a while.