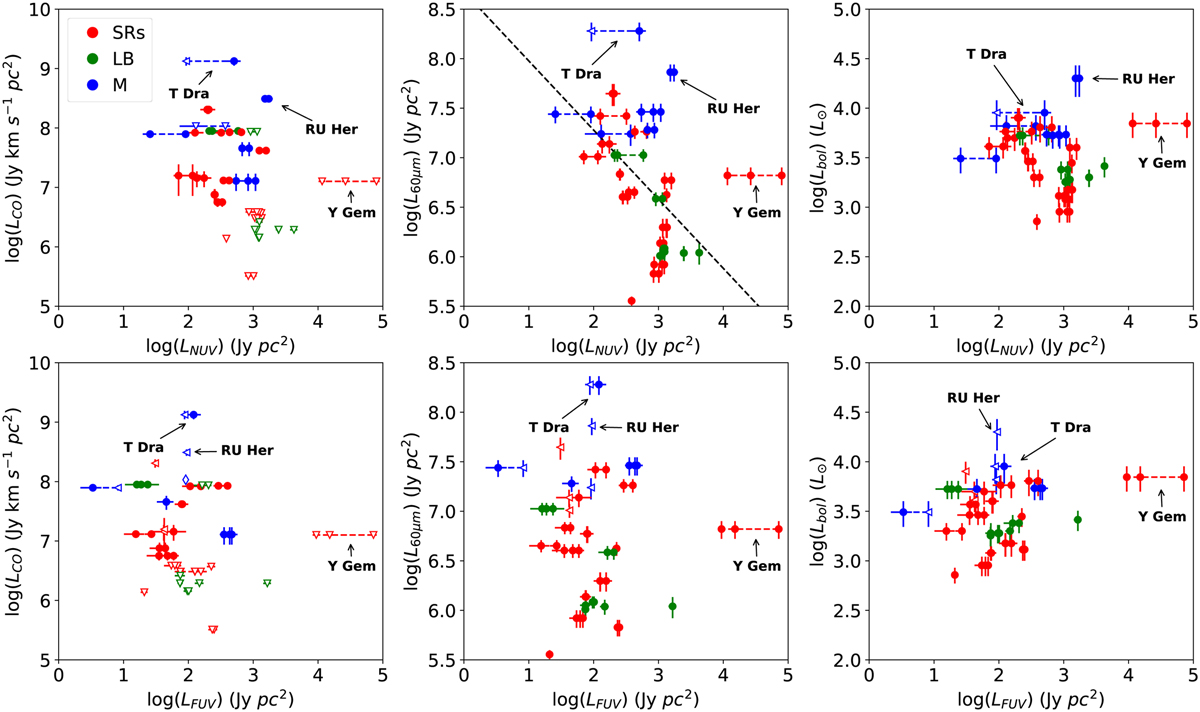
Fig. 10

Download original image
Comparisons between the 12CO (J = 2−1) velocity-integrated luminosity (LCO, left), IRAS 60 µm luminosity (L60 µm, middle), and bolometric luminosity (Lbol) with the luminosity in the GALEX NUV and FUV bands (top and bottom panels, respectively). The colour-coding used for variability types is shown in the top left panel. Triangles are upper limits. The dashed line represents the best linear fit to the F60-to-LNUV data points (Pearson’s correlation coefficient r = −0.48). The trends in the rest of the variables represented have not been confirmed (Sect. 7.2).
Current usage metrics show cumulative count of Article Views (full-text article views including HTML views, PDF and ePub downloads, according to the available data) and Abstracts Views on Vision4Press platform.
Data correspond to usage on the plateform after 2015. The current usage metrics is available 48-96 hours after online publication and is updated daily on week days.
Initial download of the metrics may take a while.


