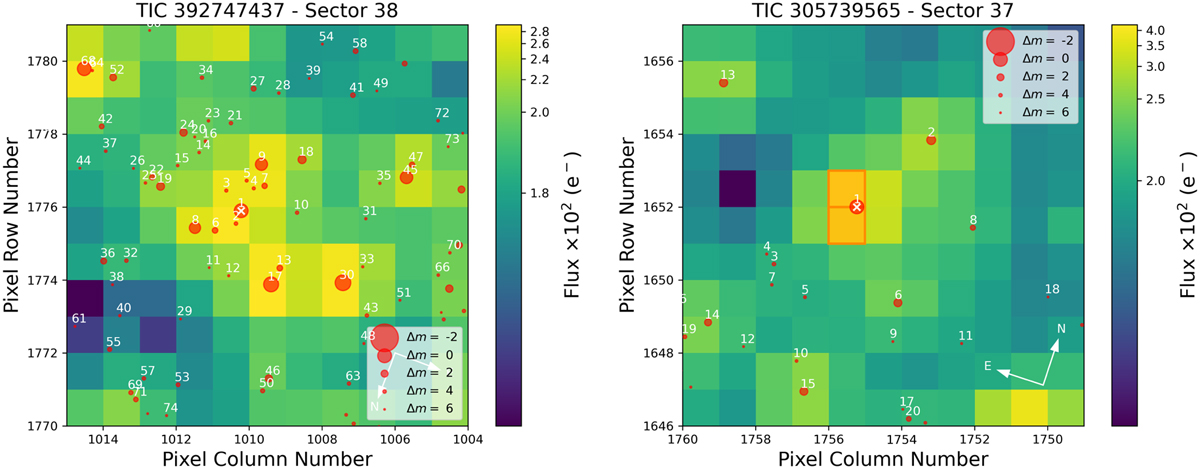
Fig. 4
Download original image
TESS imagettes of 11 × 11 pixels showing the NGTS-26 (left) and NGTS-27 (right) with white cross symbols. Stars in the imagettes, as reported from Gaia DR3, are plotted as red circles. The underlying pixel flux counts in electrons is represented by the blue to yellow colour gradient. Imagettes are taken from Sector 38 (right) and Sector 37 (left).
Current usage metrics show cumulative count of Article Views (full-text article views including HTML views, PDF and ePub downloads, according to the available data) and Abstracts Views on Vision4Press platform.
Data correspond to usage on the plateform after 2015. The current usage metrics is available 48-96 hours after online publication and is updated daily on week days.
Initial download of the metrics may take a while.