Fig. 9.
Download original image
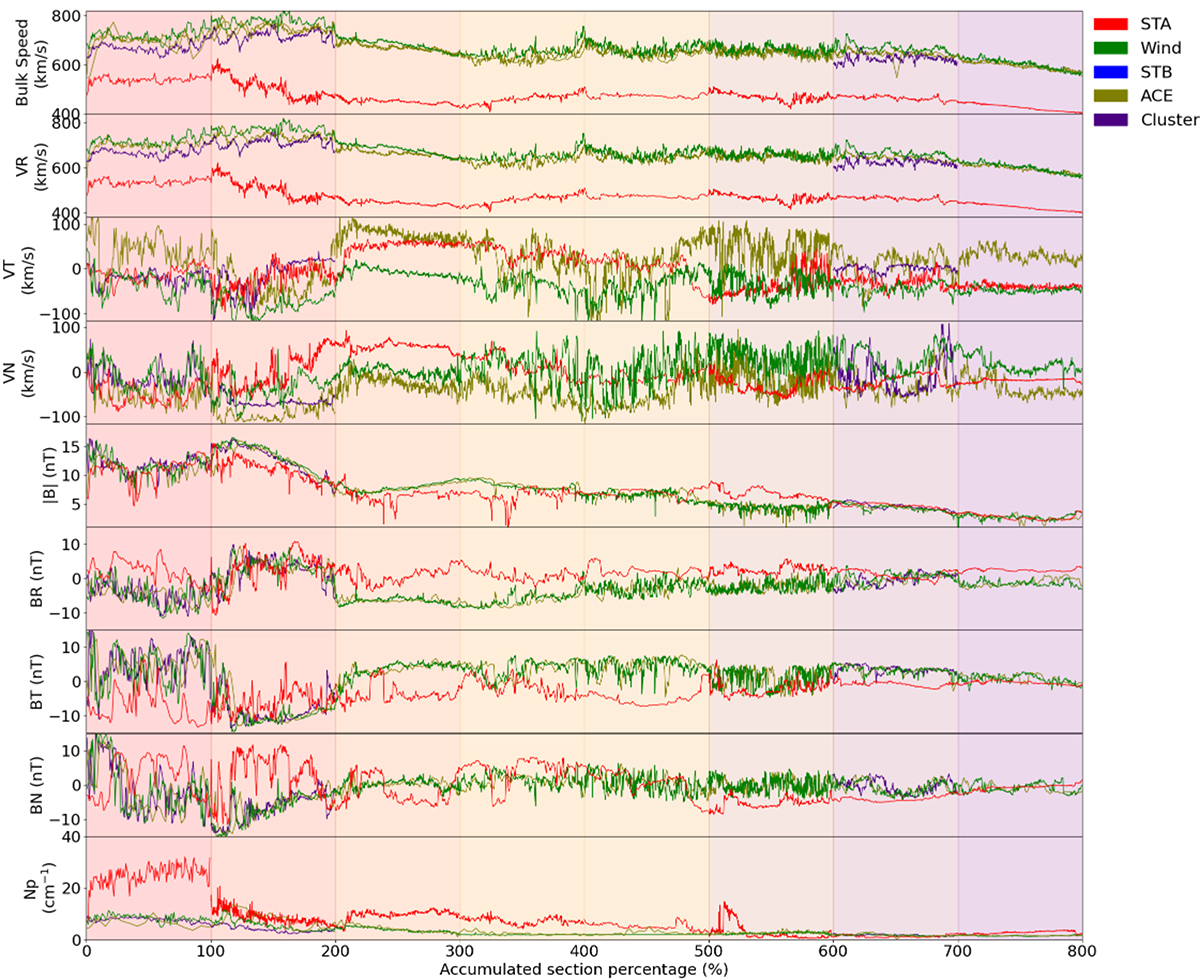
Comparison of the plasma and magnetic field properties through the different regions. From top to bottom: plasma velocity (magnitude and RTN components), magnetic field (magnitude and RTN components), and proton density. X-axis corresponds to the cumulative percentage of data points of the different regions. Each shade colour corresponds to the different regions utilised in previous figures. All data are resampled to a 1-min cadence. See text for more details.
Current usage metrics show cumulative count of Article Views (full-text article views including HTML views, PDF and ePub downloads, according to the available data) and Abstracts Views on Vision4Press platform.
Data correspond to usage on the plateform after 2015. The current usage metrics is available 48-96 hours after online publication and is updated daily on week days.
Initial download of the metrics may take a while.