Open Access
Fig. 4.
Download original image
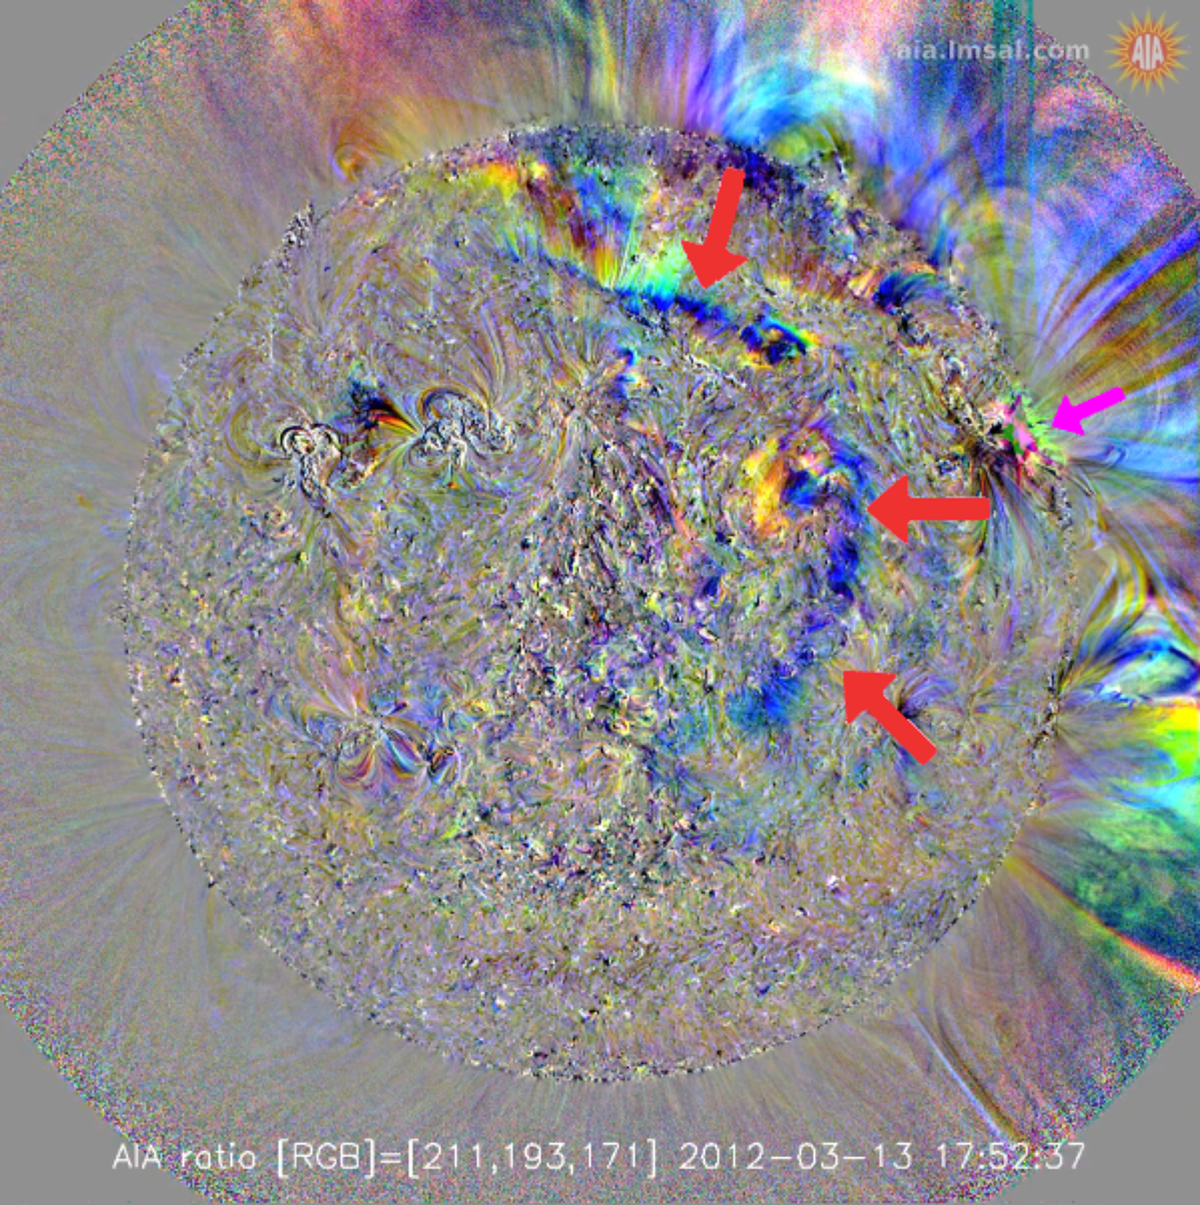
Composed running difference image from SDO/AIA 211 Å, 193 Å, and 171 Å observed on March 13 at 17:52:37 UT. Red arrows indicate the appearance of the boundary of CH1 revealed by the interaction with the CME shock wave. The pink arrow points to the AR where the CME originated.
Current usage metrics show cumulative count of Article Views (full-text article views including HTML views, PDF and ePub downloads, according to the available data) and Abstracts Views on Vision4Press platform.
Data correspond to usage on the plateform after 2015. The current usage metrics is available 48-96 hours after online publication and is updated daily on week days.
Initial download of the metrics may take a while.