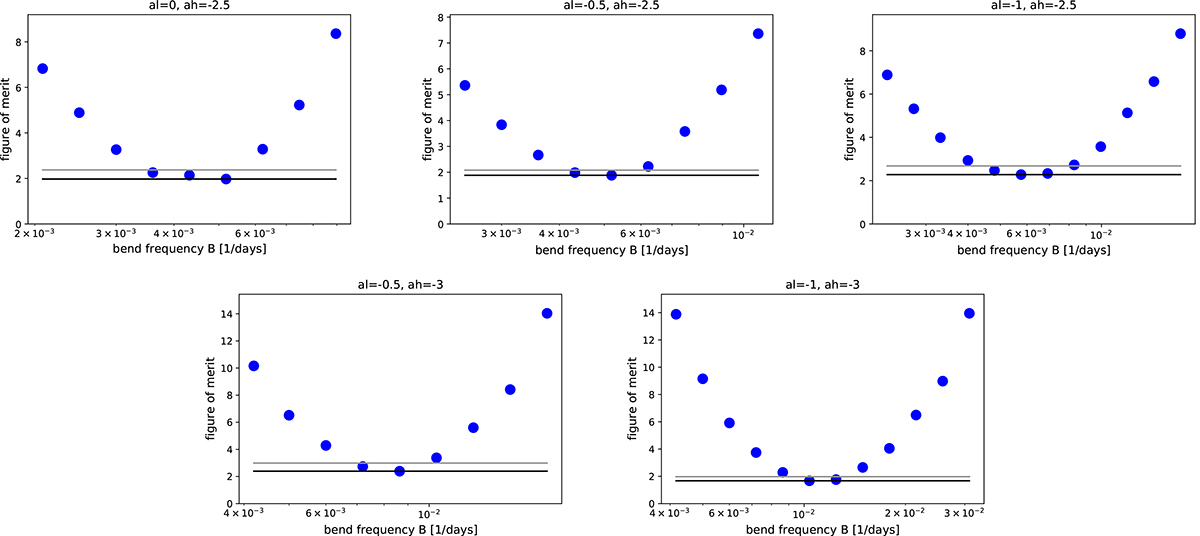
Fig. B.1.
Download original image
Figure of merit values as a function of the bend frequency for M = 108 M⊙ and REdd = 0.1, B, for the better-fitting models with different power law slopes (αL and αH, as noted in the title of each panel). Blue dots show the minimum, fom/N, for each value of B, with all other parameters free, corresponding to the second iteration, with a finer grid in the parameters. The horizontal black line marks the lowest fom/N achieved and the grey line marks the level of min(fom)/N + Δ, from which the error bounds were estimated. The value of Δ was obtained for each model, as is described in Sect. 6.1.
Current usage metrics show cumulative count of Article Views (full-text article views including HTML views, PDF and ePub downloads, according to the available data) and Abstracts Views on Vision4Press platform.
Data correspond to usage on the plateform after 2015. The current usage metrics is available 48-96 hours after online publication and is updated daily on week days.
Initial download of the metrics may take a while.