Fig. 5.
Download original image
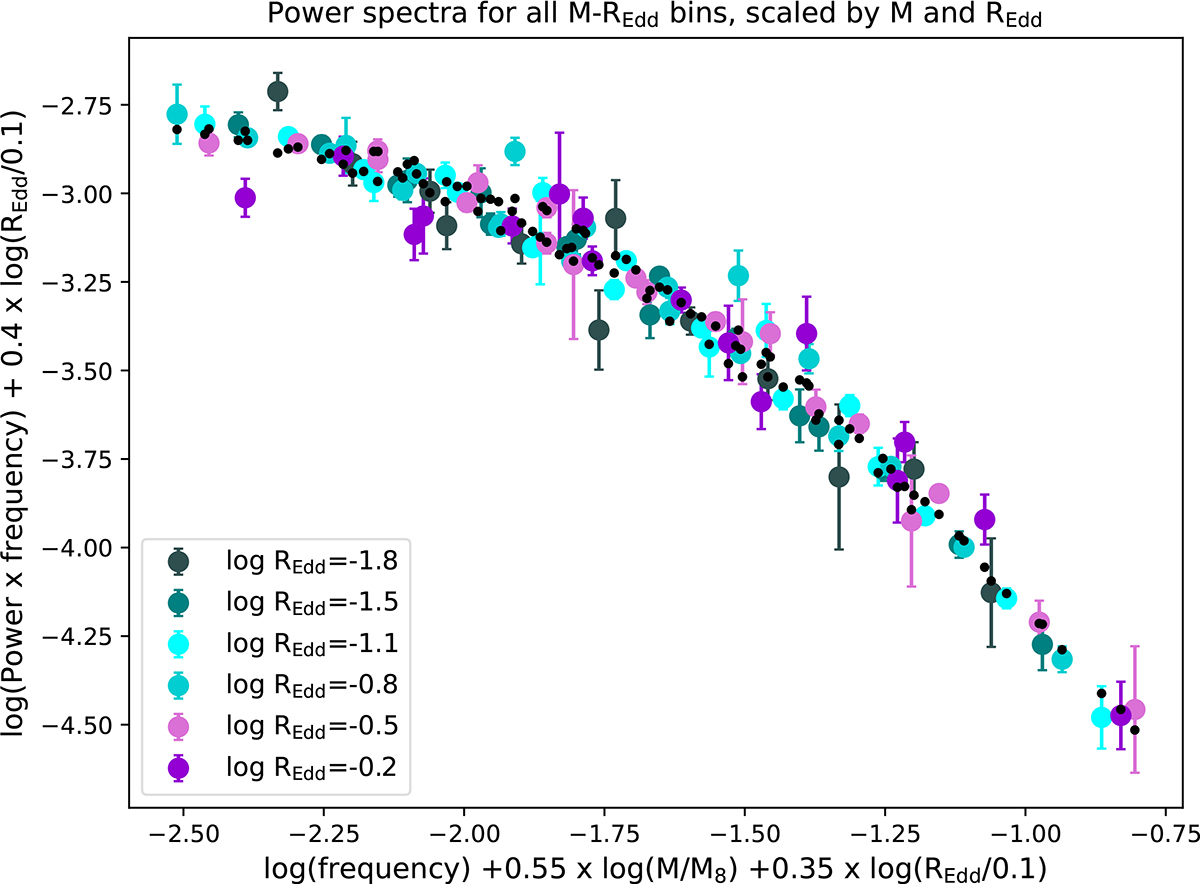
The large dots, colour-coded by REdd, represent the power spectra of the data (plotted as power × frequency), after the frequencies and amplitudes have been re-scaled according to the mass and REdd of each bin and the best-fitting scaling parameters, C = −0.55, D = −0.35, and F = −0.4. The black dots represent a “folded” model constructed from a bending power law model with αL = −1 and αH = −3. Frequencies are in units of day−1.
Current usage metrics show cumulative count of Article Views (full-text article views including HTML views, PDF and ePub downloads, according to the available data) and Abstracts Views on Vision4Press platform.
Data correspond to usage on the plateform after 2015. The current usage metrics is available 48-96 hours after online publication and is updated daily on week days.
Initial download of the metrics may take a while.