Fig. 4.
Download original image
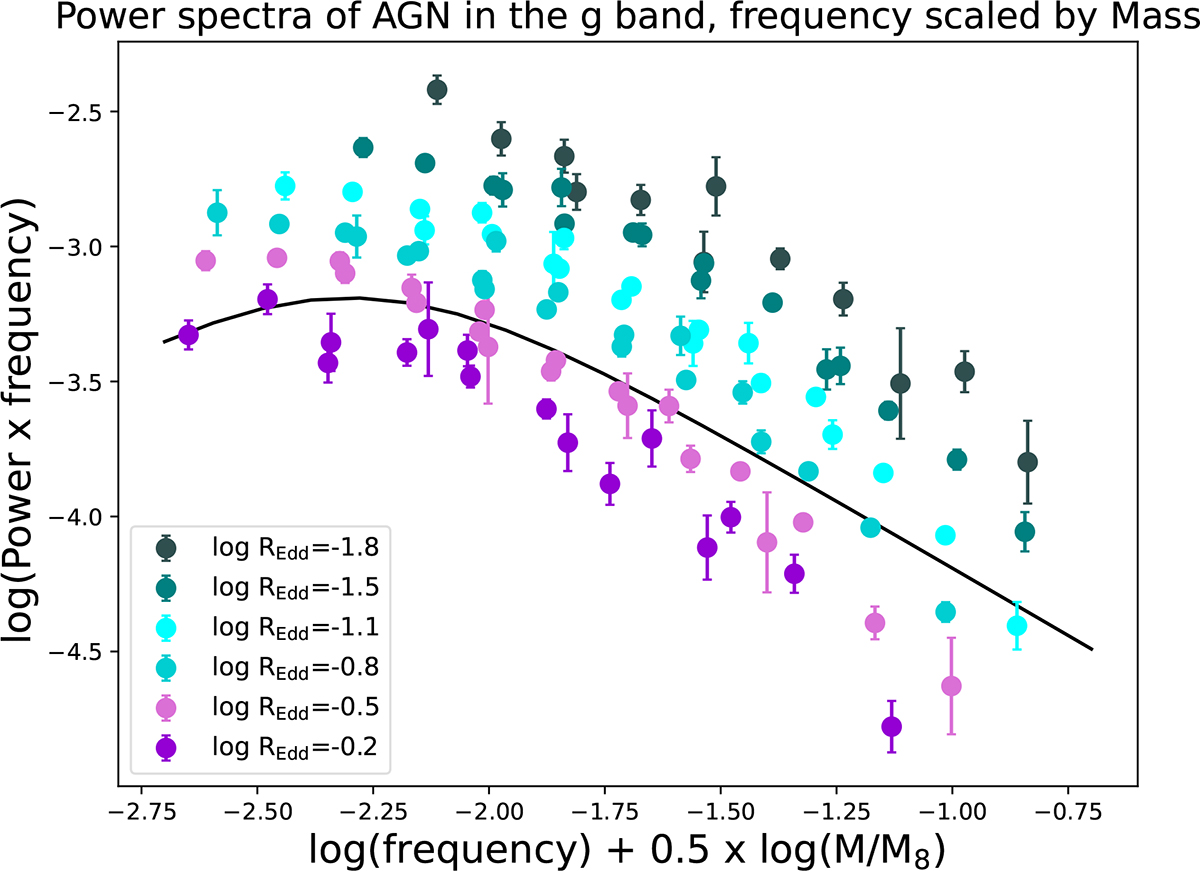
Power spectra (plotted as power × frequency) of all the sources, binned by mass and Eddington ratio. The variances were calculated for timescales of 30, 75, 150, and 300 days, and in this plot the corresponding frequencies, f = 1/t, were multiplied by (M/M8)0.5 to put them on a common x-axis scaled to the bend timescale approximately, as was measured by Burke et al. (2021). The colour represents the different bins in REdd. The solid black line represents a bending power law model with αL = 0 and αH = −2, similar to the DRW model, with a bend timescale of 200 days for a 108 M⊙ black hole. (We note that as power is multiplied by frequency in the plot, the part of the black line with αL = 0 appears to rise with frequency.) Frequencies are in units of day−1.
Current usage metrics show cumulative count of Article Views (full-text article views including HTML views, PDF and ePub downloads, according to the available data) and Abstracts Views on Vision4Press platform.
Data correspond to usage on the plateform after 2015. The current usage metrics is available 48-96 hours after online publication and is updated daily on week days.
Initial download of the metrics may take a while.