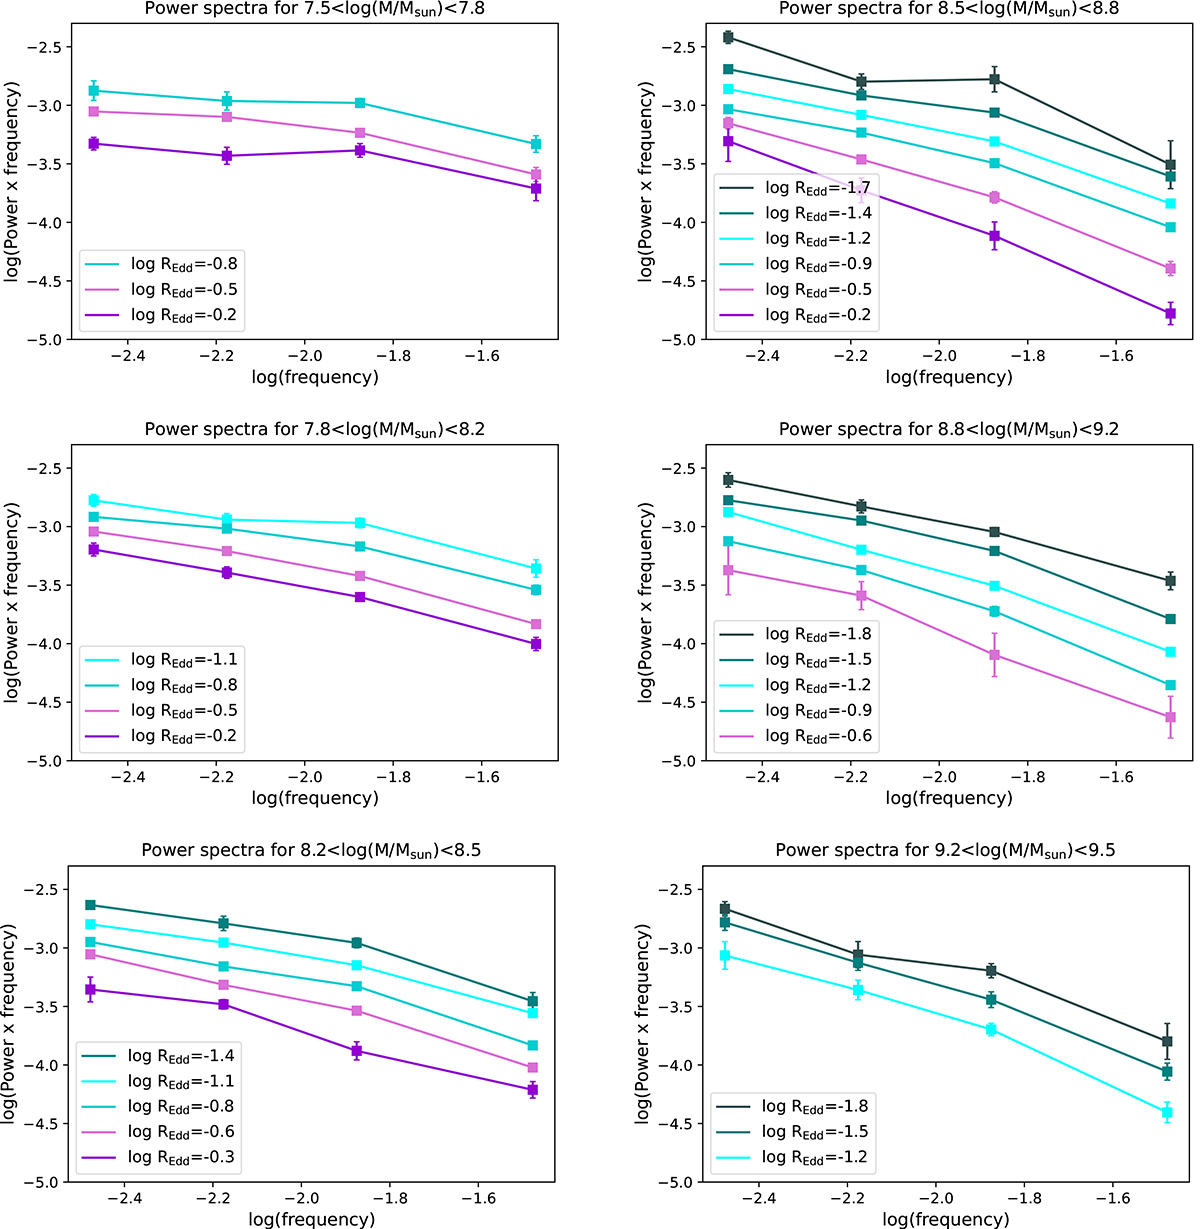
Fig. 2.
Download original image
Low-resolution power spectra (plotted as power × frequency) for different mass bins in different panels and different accretion rate levels in different colours. The markers represent the median variance of all quasars falling in each M − REdd bin and temporal frequency, and the error bars represent the rms of the median for each bin obtained by bootstrapping the samples. Frequencies are in units of day−1.
Current usage metrics show cumulative count of Article Views (full-text article views including HTML views, PDF and ePub downloads, according to the available data) and Abstracts Views on Vision4Press platform.
Data correspond to usage on the plateform after 2015. The current usage metrics is available 48-96 hours after online publication and is updated daily on week days.
Initial download of the metrics may take a while.