Fig. 1.
Download original image
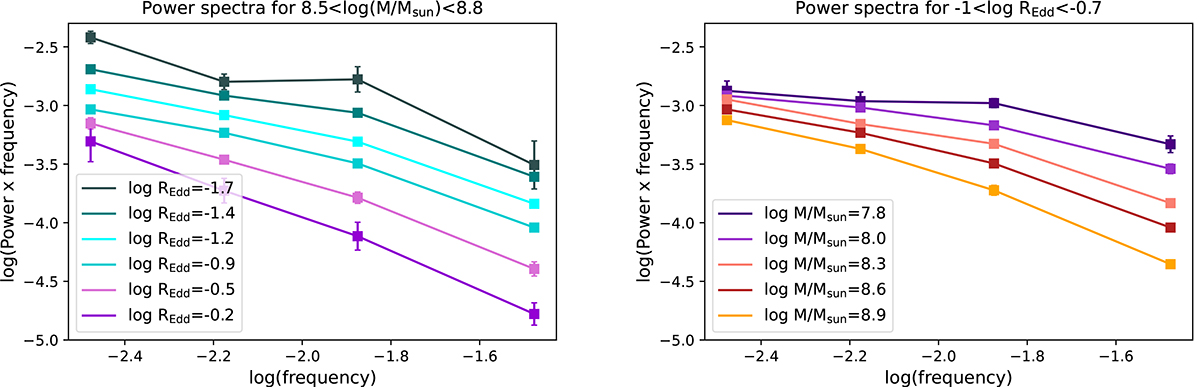
Low-resolution power spectra for different values of REdd within a narrow range in black hole mass (left) and different black hole masses but similar values of REdd (right). The markers represent the median variance (i.e., power × frequency) of all quasars falling in each M − REdd bin and temporal frequency, and the error bars represent the root-mean-squared (rms) of the median for each bin obtained by bootstrapping the samples. The power spectra depend on both parameters but in different ways: the mass changes the slope (or the location of the bend in the power spectrum, as described in Sect. 4) and the accretion rate modifies mostly the normalisation, although some change in the slope is apparent. Frequencies are in units of day−1.
Current usage metrics show cumulative count of Article Views (full-text article views including HTML views, PDF and ePub downloads, according to the available data) and Abstracts Views on Vision4Press platform.
Data correspond to usage on the plateform after 2015. The current usage metrics is available 48-96 hours after online publication and is updated daily on week days.
Initial download of the metrics may take a while.