Fig. E.1.
Download original image
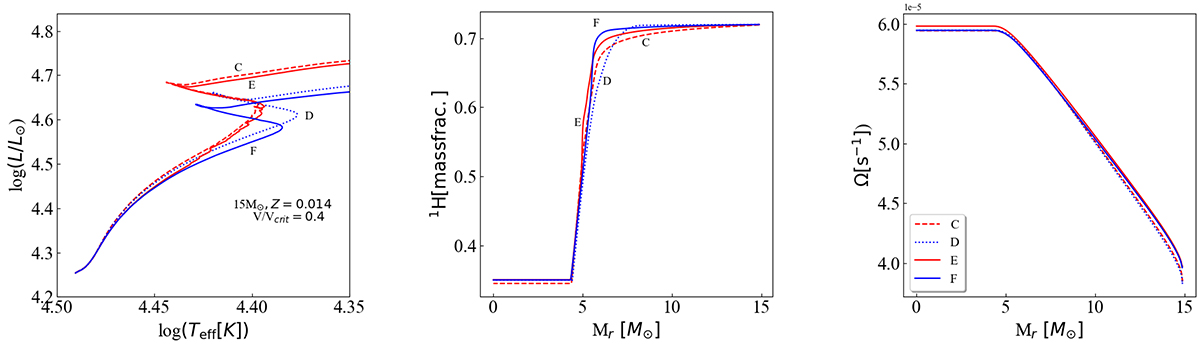
Variation of physical parameters in the 15 M⊙ models. Left panel: Evolutionary tracks during the MS phase in the Hertzsprung-Russell diagram for models C, D, E, and F (see Table 1) as a function of the Lagrangian mass for the 15 M⊙ at Z = 0.014 and with Vini/Vcrit = 0.4. Middle panel: Abundance of hydrogen in mass fraction ranging from the center to the outer envelope of the models when the central mass fraction of hydrogen is Xc = 0.35. Right panel: Variations in the angular velocity vs. the mass coordinate for the same models as are shown in the middle panel.
Current usage metrics show cumulative count of Article Views (full-text article views including HTML views, PDF and ePub downloads, according to the available data) and Abstracts Views on Vision4Press platform.
Data correspond to usage on the plateform after 2015. The current usage metrics is available 48-96 hours after online publication and is updated daily on week days.
Initial download of the metrics may take a while.