Fig. 11.
Download original image
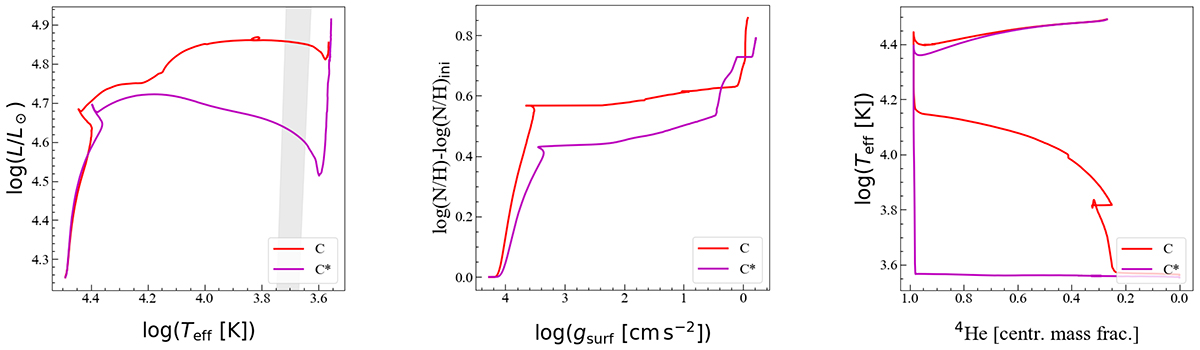
Models C and C* with a mass 15 M⊙ with Vini/Vcrit = 0.4. Left panel: evolutionary tracks in the Hertzsprung-Russell diagram during the MS phase. Middle panel: change in the nitrogen to hydrogen ratio normalized to the initial value vs. the surface gravity. Right panel: variation in the effective temperature as a function of the central helium mass fraction.
Current usage metrics show cumulative count of Article Views (full-text article views including HTML views, PDF and ePub downloads, according to the available data) and Abstracts Views on Vision4Press platform.
Data correspond to usage on the plateform after 2015. The current usage metrics is available 48-96 hours after online publication and is updated daily on week days.
Initial download of the metrics may take a while.