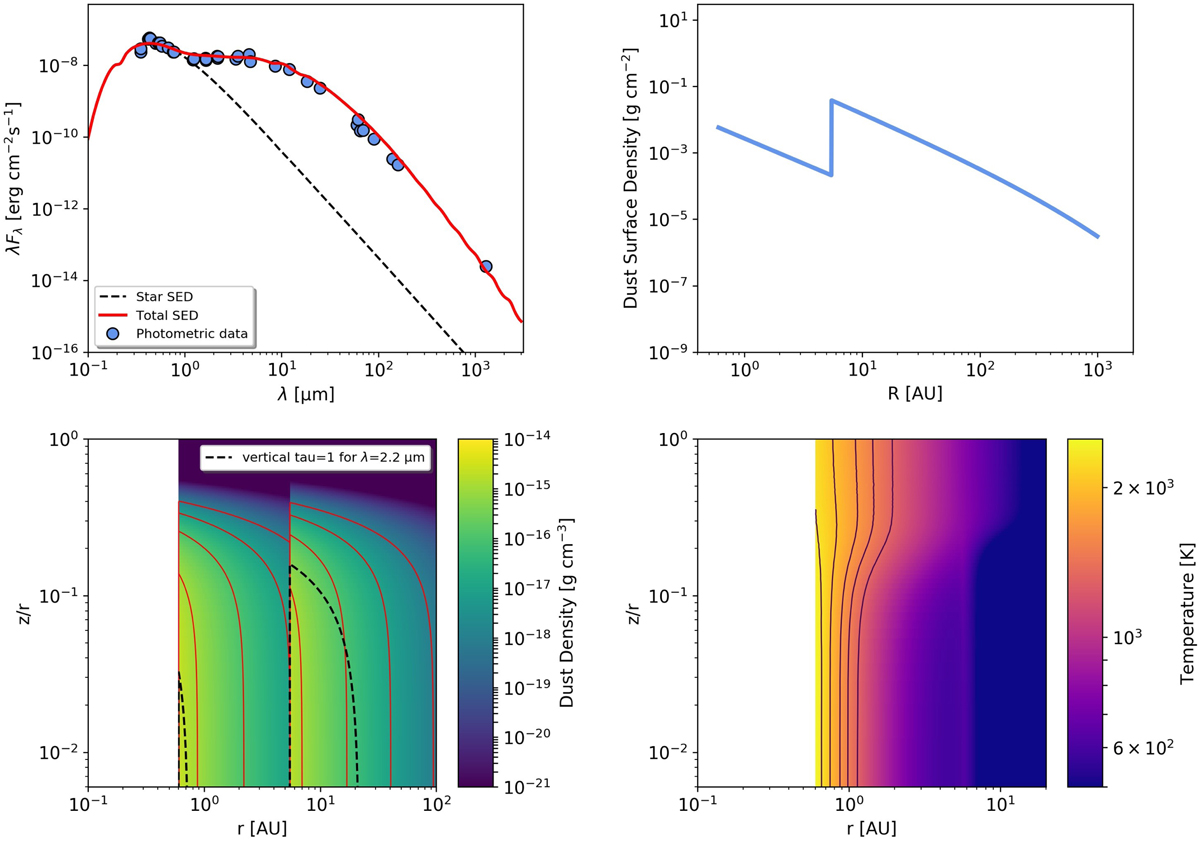
Fig. 6
Download original image
Radiative transfer modeling corresponding to Table 6. The top left panel shows the SED for Model CS, with the blue dashed line representing the stellar black-body function and the red line showing the modeled total emission. The black bars represent the photometric data. The top right panel shows the derived dust surface density profile as a function of the distance from the star. The bottom left plot shows the dust density structure, where the black dashed line represents the τ = 1 surface at 2.2 μm, and the red lines represent, from left to right and for both components, the density contours at 10−15, 10−16, 10−17, and 10−18 g cm−3, respectively. The bottom right plot shows the dust temperature structure, where the black lines represent, from left to right, the isothermal contours at 2300, 2000, 1700, 1500, and 1300 K, respectively.
Current usage metrics show cumulative count of Article Views (full-text article views including HTML views, PDF and ePub downloads, according to the available data) and Abstracts Views on Vision4Press platform.
Data correspond to usage on the plateform after 2015. The current usage metrics is available 48-96 hours after online publication and is updated daily on week days.
Initial download of the metrics may take a while.