Fig. 5
Download original image
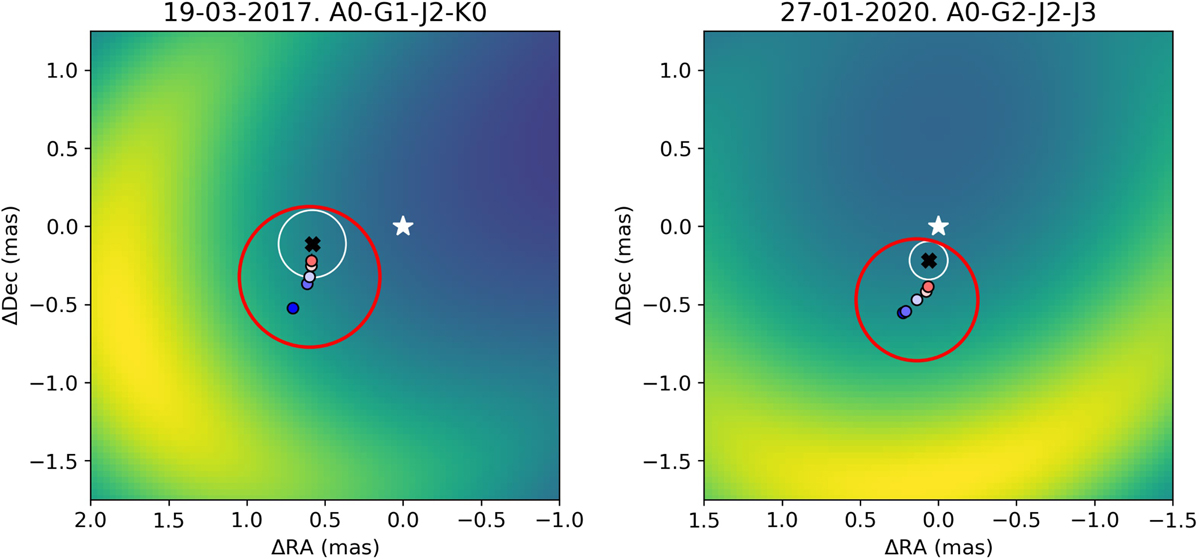
Spatial and kinematic properties of the Bry-line-emitting gas region overlaid to the continuum model for two epochs. The complete sequence is shown in Appendix G. The star is centered on the origin. The black cross and the white circle around it show the position of the continuum photocenter and its uncertainty estimated from the continuum modeling. The red circle represents the extent of the gas-emitting region estimated at the peak of the line emission and centered at about ~0km s–1. The blue to red colored filled dots show the gas photocenter positions for the five spectral channels across the Bry line corresponding to velocities ranging from-100km s–1 to +100 km s–1, as color-coded in Fig. A.3.
Current usage metrics show cumulative count of Article Views (full-text article views including HTML views, PDF and ePub downloads, according to the available data) and Abstracts Views on Vision4Press platform.
Data correspond to usage on the plateform after 2015. The current usage metrics is available 48-96 hours after online publication and is updated daily on week days.
Initial download of the metrics may take a while.