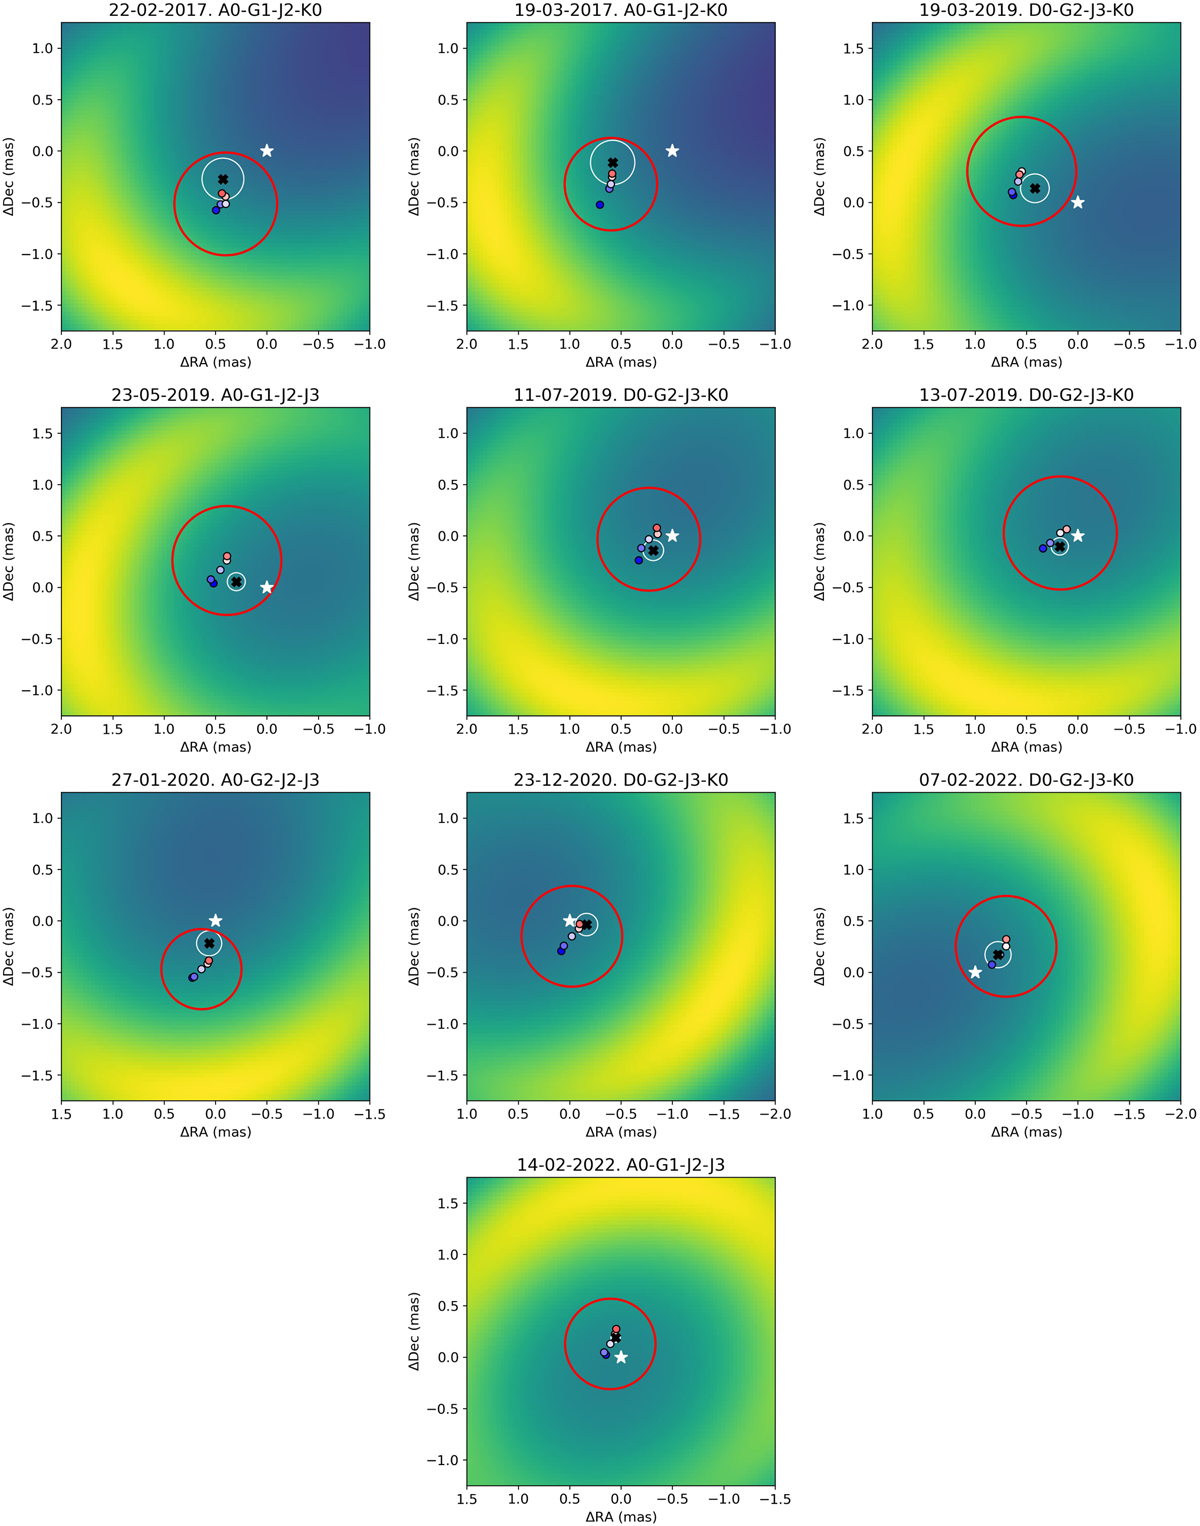
Fig. G.1
Download original image
GRAVITY continuum model images and Brγ-line-emitting gas region. The black filled dot shows the continuum (star + halo + disk) photocenter. The white circle around that point gives the error on the continuum photocenter position estimated from the continuum modeling. The red circle represents the gas region size estimated at the peak emission and is centered on the ~0 km s−1 point. The blue to red colored filled dots show the gas photocenters for different spectral channels, as in Fig. A.3.
Current usage metrics show cumulative count of Article Views (full-text article views including HTML views, PDF and ePub downloads, according to the available data) and Abstracts Views on Vision4Press platform.
Data correspond to usage on the plateform after 2015. The current usage metrics is available 48-96 hours after online publication and is updated daily on week days.
Initial download of the metrics may take a while.