Fig. F.1
Download original image
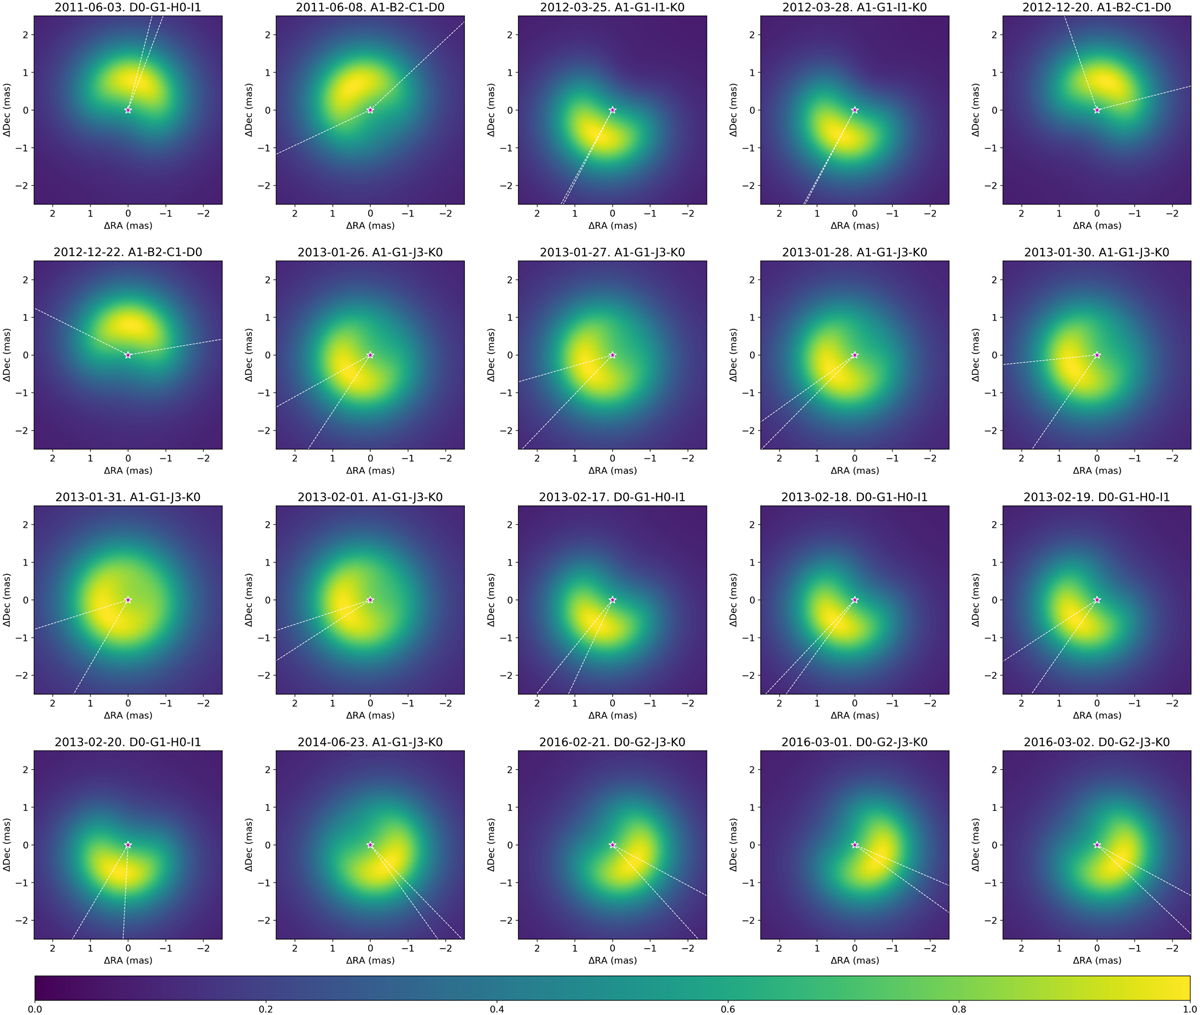
Peak-normalized PIONIER continuum model images. The dashed white lines represent the ±3σ MCMC uncertainties on the PA of the azimuthal modulation. A description of the model is given in Sect. 3. The central object is not displayed in order to enhance the circumstellar emission. The contrast reported in Sect. 3.3 is calculated from the peak-normalized brightness distribution map as the ratio between the brightest pixel in the map and the corresponding centro-symmetric position in the disk. We report the standard deviation for the mean contrast value across the different PIONIER epochs.
Current usage metrics show cumulative count of Article Views (full-text article views including HTML views, PDF and ePub downloads, according to the available data) and Abstracts Views on Vision4Press platform.
Data correspond to usage on the plateform after 2015. The current usage metrics is available 48-96 hours after online publication and is updated daily on week days.
Initial download of the metrics may take a while.