Fig. E.1
Download original image
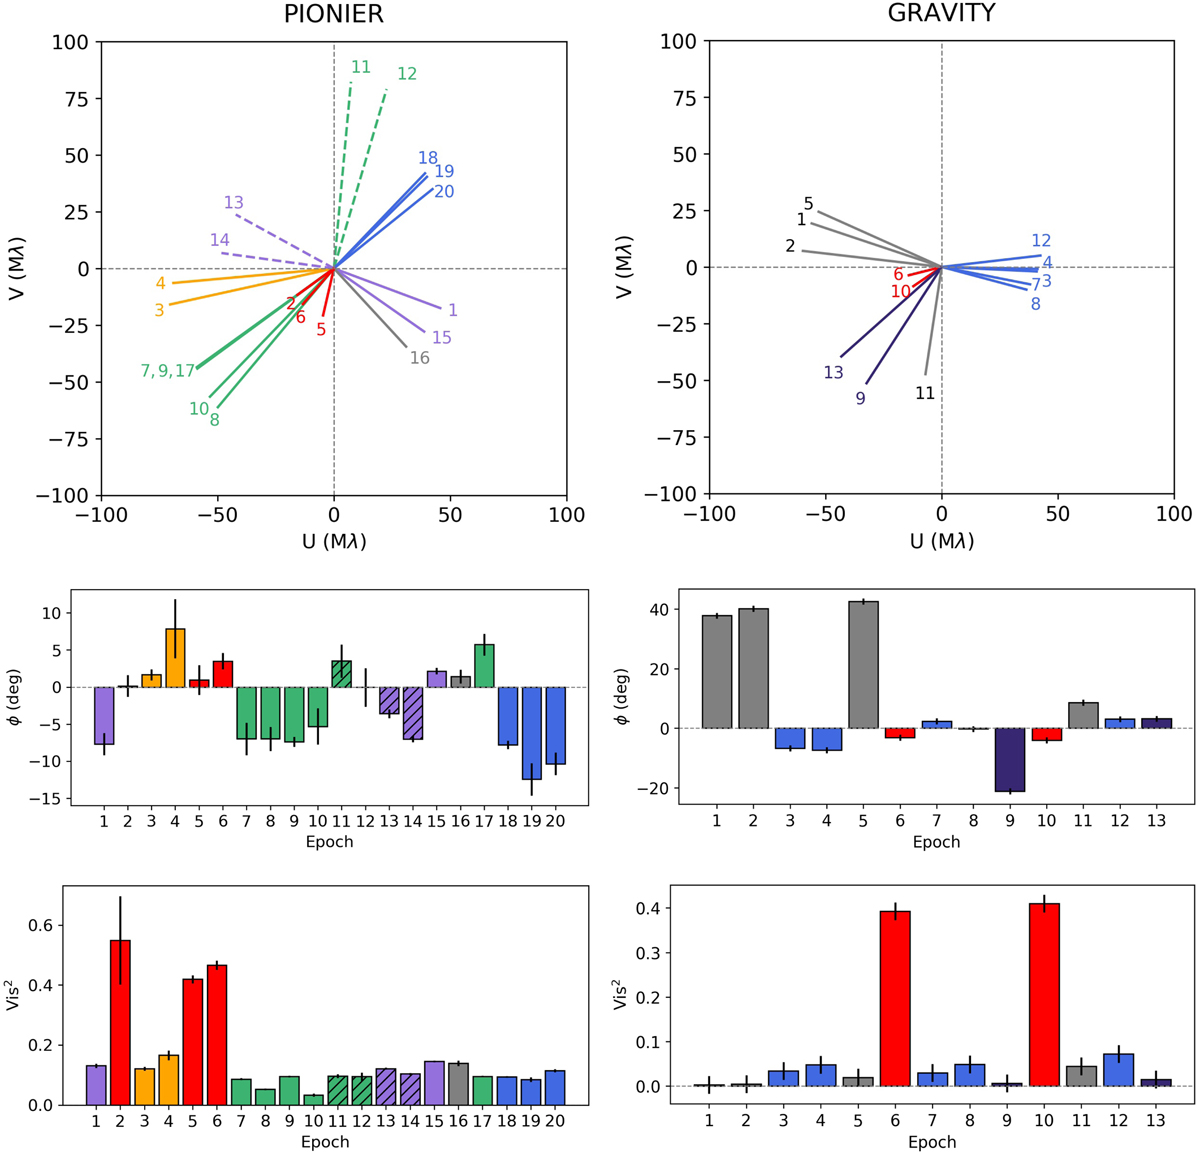
HD 98922 PIONIER and GRAVITY continuum data overview. Top row: Overview diagram summarizing Fig. A.1 and Fig. A.2 and showing array configurations with comparable (u,v) coverage. Each line shows the spatial frequency and PA probed by the longest baseline of a given four-telescope configuration. Two epochs have the same color and line style if they show a similar (u,v) coverage. The gray lines refer to epochs for which the (u,v) coverage cannot be reasonably compared to any other. Numbers identify epochs following Table A.1 and A.2; Middle row: Closure phase signal per epoch and instrument. The spatial frequency chosen is the one for which a strong variation in the CP signal between epochs with a comparable (u,v) plane coverage is observed. Bottom row: Squared visibilities signal for each epoch and instrument, for the same spatial frequency as in the middle row.
Current usage metrics show cumulative count of Article Views (full-text article views including HTML views, PDF and ePub downloads, according to the available data) and Abstracts Views on Vision4Press platform.
Data correspond to usage on the plateform after 2015. The current usage metrics is available 48-96 hours after online publication and is updated daily on week days.
Initial download of the metrics may take a while.