Fig. 2
Download original image
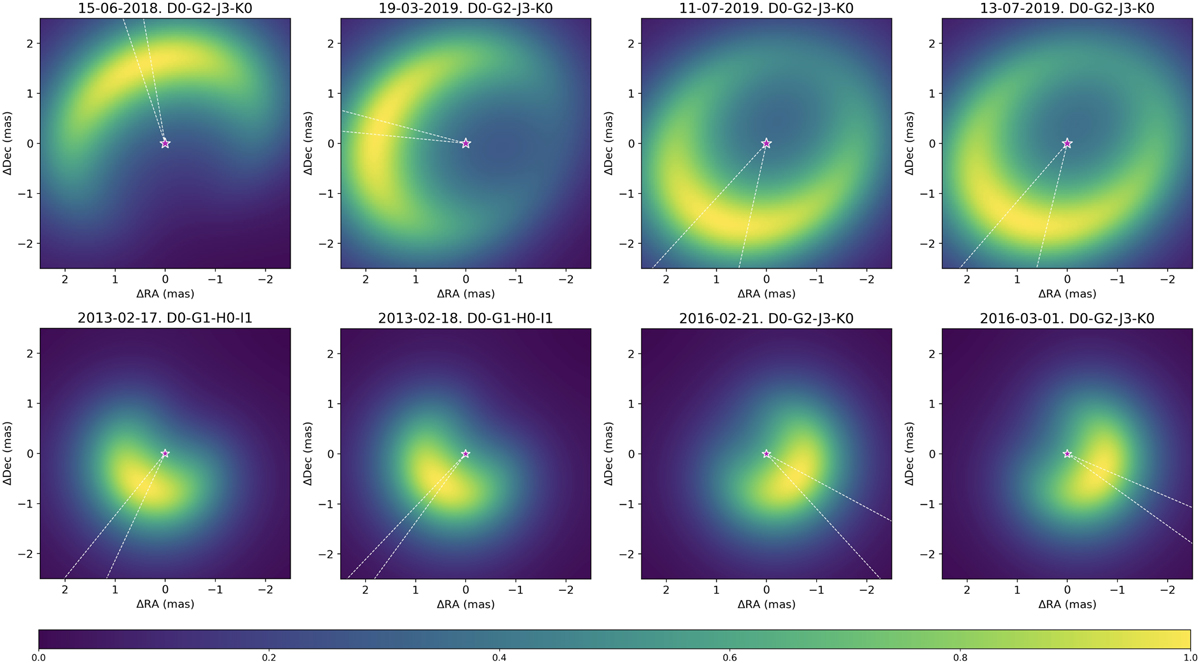
Peak-normalized GRAVITY (top row) and PIONIER (bottom row) continuum model images. The dashed white lines represent the ±3σ uncertainty on the PA of the azimuthal modulation. The central object is not displayed but is marked with a star to enhance the circumstellar emission. North is up, east is to the left. See Appendix F for the full data set.
Current usage metrics show cumulative count of Article Views (full-text article views including HTML views, PDF and ePub downloads, according to the available data) and Abstracts Views on Vision4Press platform.
Data correspond to usage on the plateform after 2015. The current usage metrics is available 48-96 hours after online publication and is updated daily on week days.
Initial download of the metrics may take a while.