Open Access
Fig. B.1
Download original image
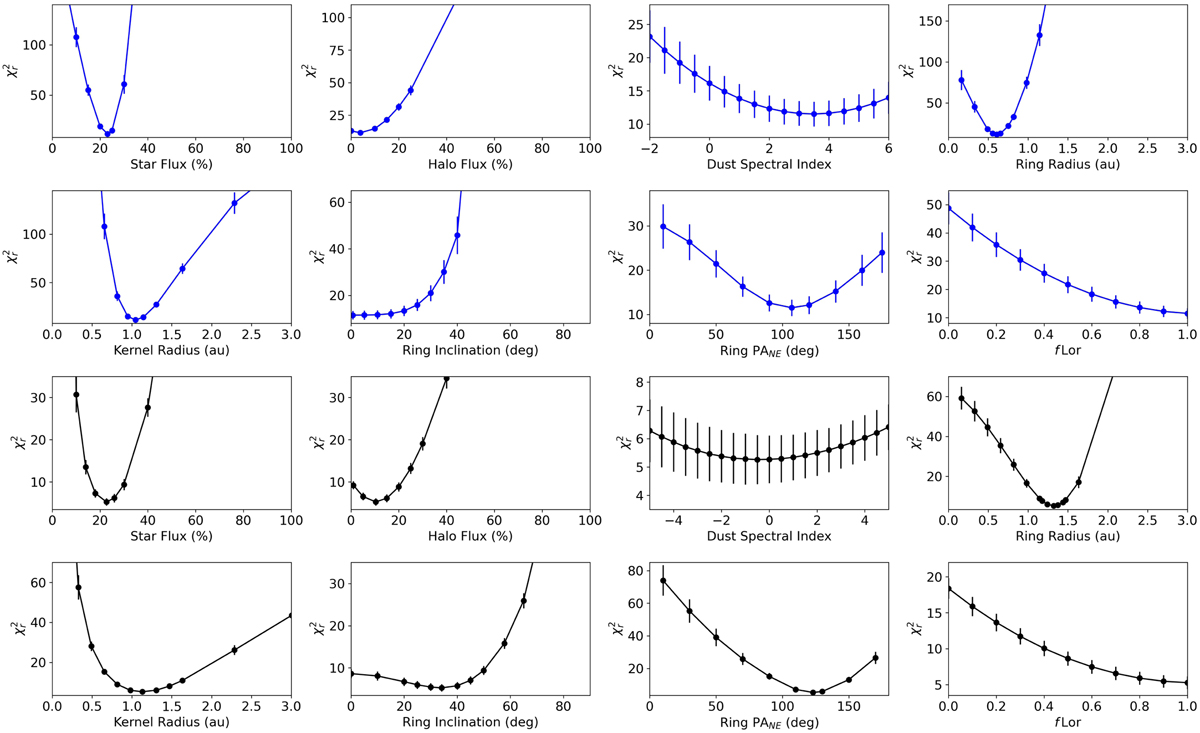
Reduced chi-square ![]() curves of each nontime-variable parameter from the azimuthal modulation global fit model. The first two rows, where the curves are blue, refer to the PIONIER data model, while the last two rows, where the curves are black, refer to the GRAVITY data model.
curves of each nontime-variable parameter from the azimuthal modulation global fit model. The first two rows, where the curves are blue, refer to the PIONIER data model, while the last two rows, where the curves are black, refer to the GRAVITY data model.
Current usage metrics show cumulative count of Article Views (full-text article views including HTML views, PDF and ePub downloads, according to the available data) and Abstracts Views on Vision4Press platform.
Data correspond to usage on the plateform after 2015. The current usage metrics is available 48-96 hours after online publication and is updated daily on week days.
Initial download of the metrics may take a while.