Fig. 9
Download original image
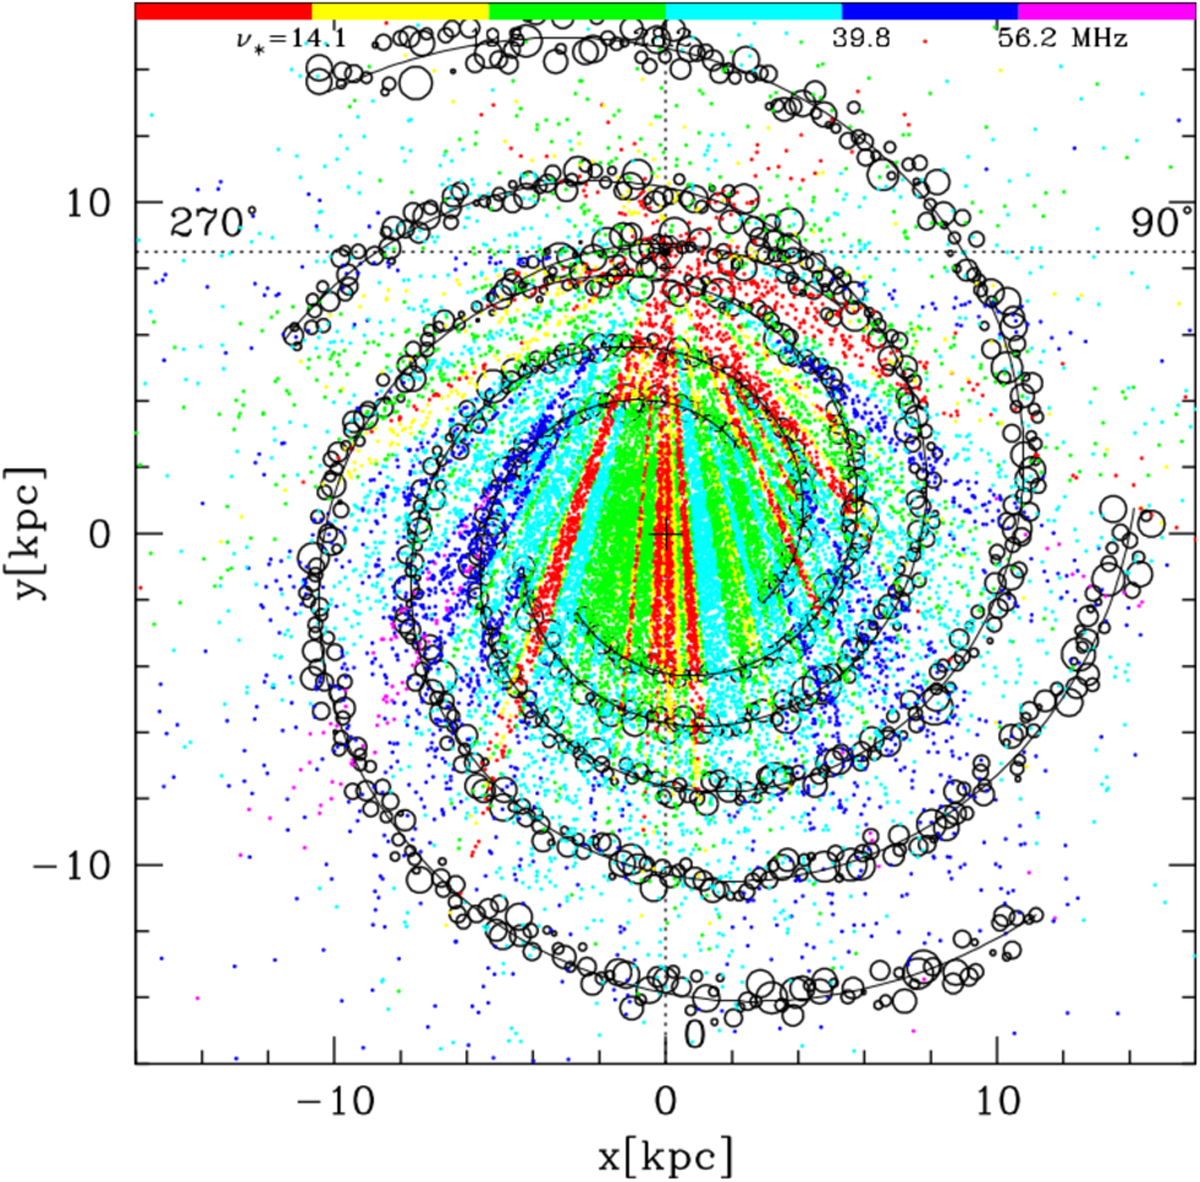
Spatial distribution of an assumed mock sample of 20 000 SNRs (points coloured by log(v*/MHz) using the colour bar code). Absorbers (open circles) are distributed along the Galactic spiral arms taken from the Hou & Han (2014) model (solid black curves). Each absorber is assumed to have a constant low density ne = 2.0 cm−3, a temperature Te = 5000 K, and radius r drawn from a Maxwell-Boltzmann probability density distribution with a median of 50 pc. The scale of each open circle has been expanded by an arbitrary factor of 3 in order to make the plot clearer. The central plus symbol indicates the position of the Galactic centre, the solar symbol shows the Sun’s position, and the dotted lines the Galactic quadrants. The coloured points do not show any strong dependence on heliocentric distance or Galactic longitude (see Figs. 10 and 11).
Current usage metrics show cumulative count of Article Views (full-text article views including HTML views, PDF and ePub downloads, according to the available data) and Abstracts Views on Vision4Press platform.
Data correspond to usage on the plateform after 2015. The current usage metrics is available 48-96 hours after online publication and is updated daily on week days.
Initial download of the metrics may take a while.