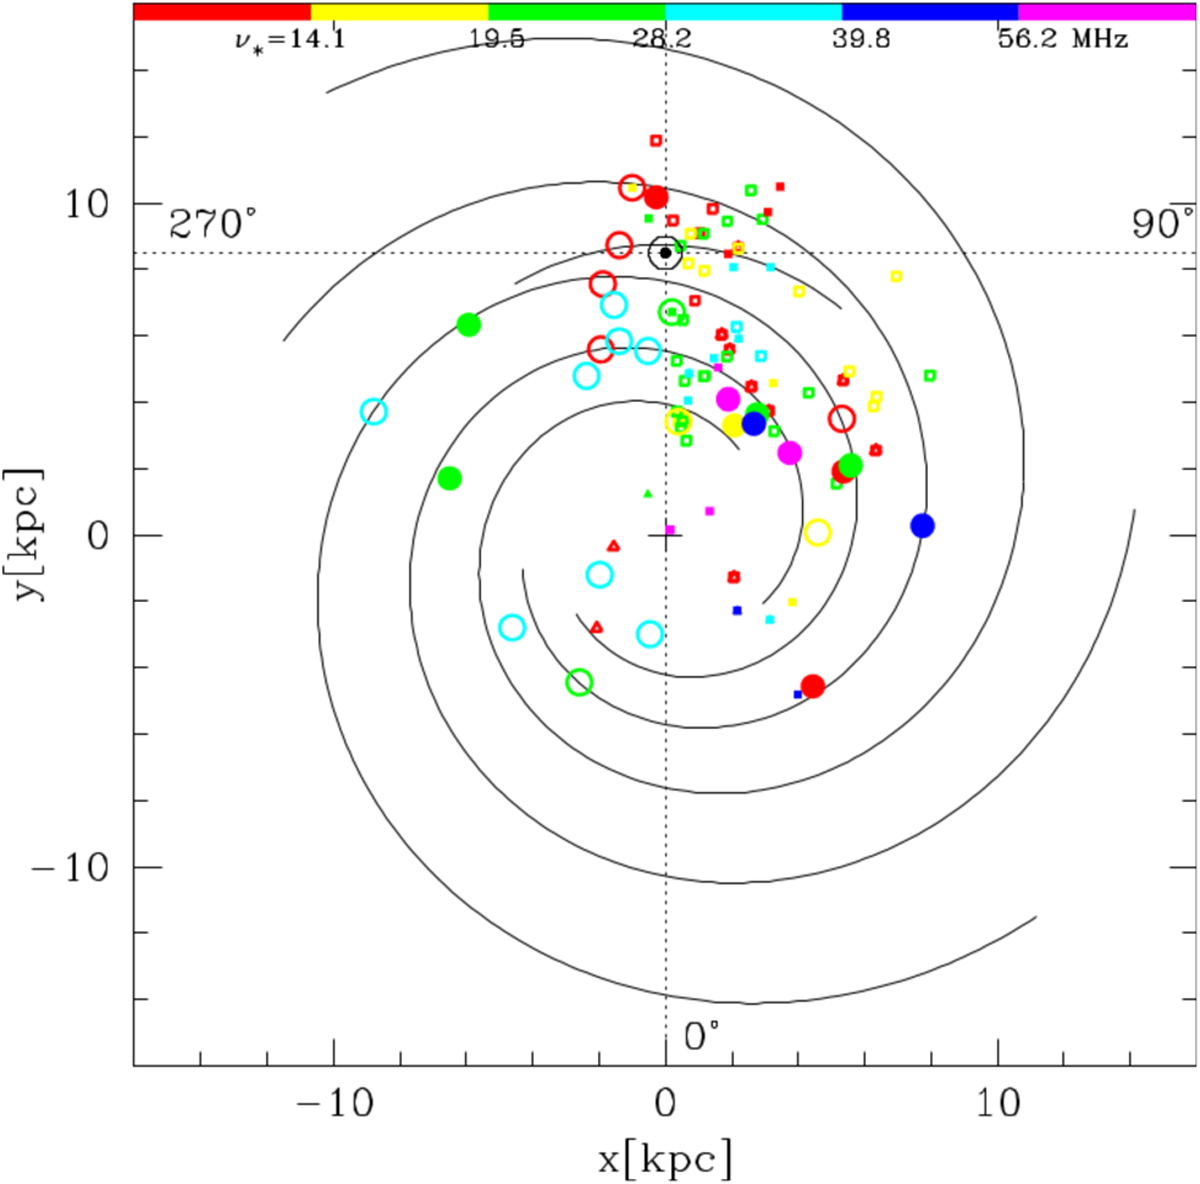
Fig. 8
Download original image
Projected spatial distribution onto the Galactic plane of SNRs in the three samples analyzed here with distances taken from Ranasinghe & Leahy (2022) and coloured according to log(ν∗/MHz) using the colour bar code. Filled symbols show the location of SNRs with turnover spectra, while the open symbols indicate those sources not showing turnovers. Circles correspond to Castelletti et al. (2021) plus this work data, squares correspond to Kovalenko et al. (1994b), and triangles to Kassim (1989). As a guidance the solid black lines show the position of the spiral arms taken from the Hou & Han (2014) model. The central plus symbol indicates the position of the Galactic centre, the solar symbol shows the Sun’s position, and the dotted lines the Galactic quadrants. The coloured points do not show any strong dependence on heliocentric distance or Galactic longitude (see Figs. 10 and 11).
Current usage metrics show cumulative count of Article Views (full-text article views including HTML views, PDF and ePub downloads, according to the available data) and Abstracts Views on Vision4Press platform.
Data correspond to usage on the plateform after 2015. The current usage metrics is available 48-96 hours after online publication and is updated daily on week days.
Initial download of the metrics may take a while.