Fig. 7
Download original image
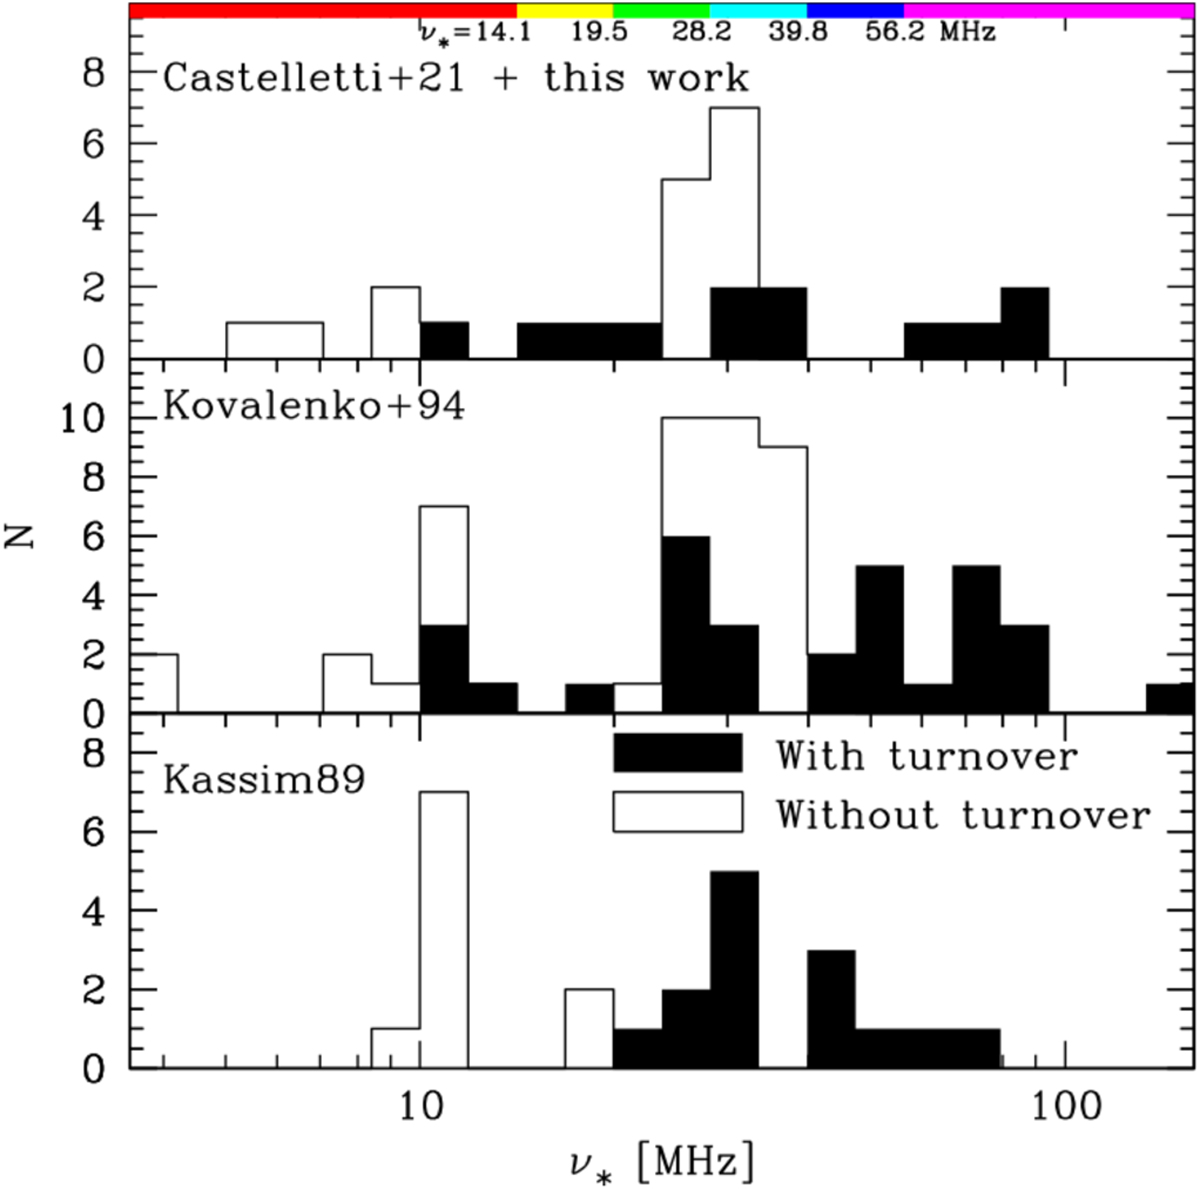
Histograms showing the distribution of characteristic frequencies, v* for the three samples analyzed here. Each panel corresponds to a different sample, as indicated by the labels. The filled histograms show the distribution of v* for SNRs spectra with turnovers, while the open ones depict the estimated upper limit of v* based on the lowest measured frequency, vlow, for spectra without turnovers.
Current usage metrics show cumulative count of Article Views (full-text article views including HTML views, PDF and ePub downloads, according to the available data) and Abstracts Views on Vision4Press platform.
Data correspond to usage on the plateform after 2015. The current usage metrics is available 48-96 hours after online publication and is updated daily on week days.
Initial download of the metrics may take a while.