Fig. 4
Download original image
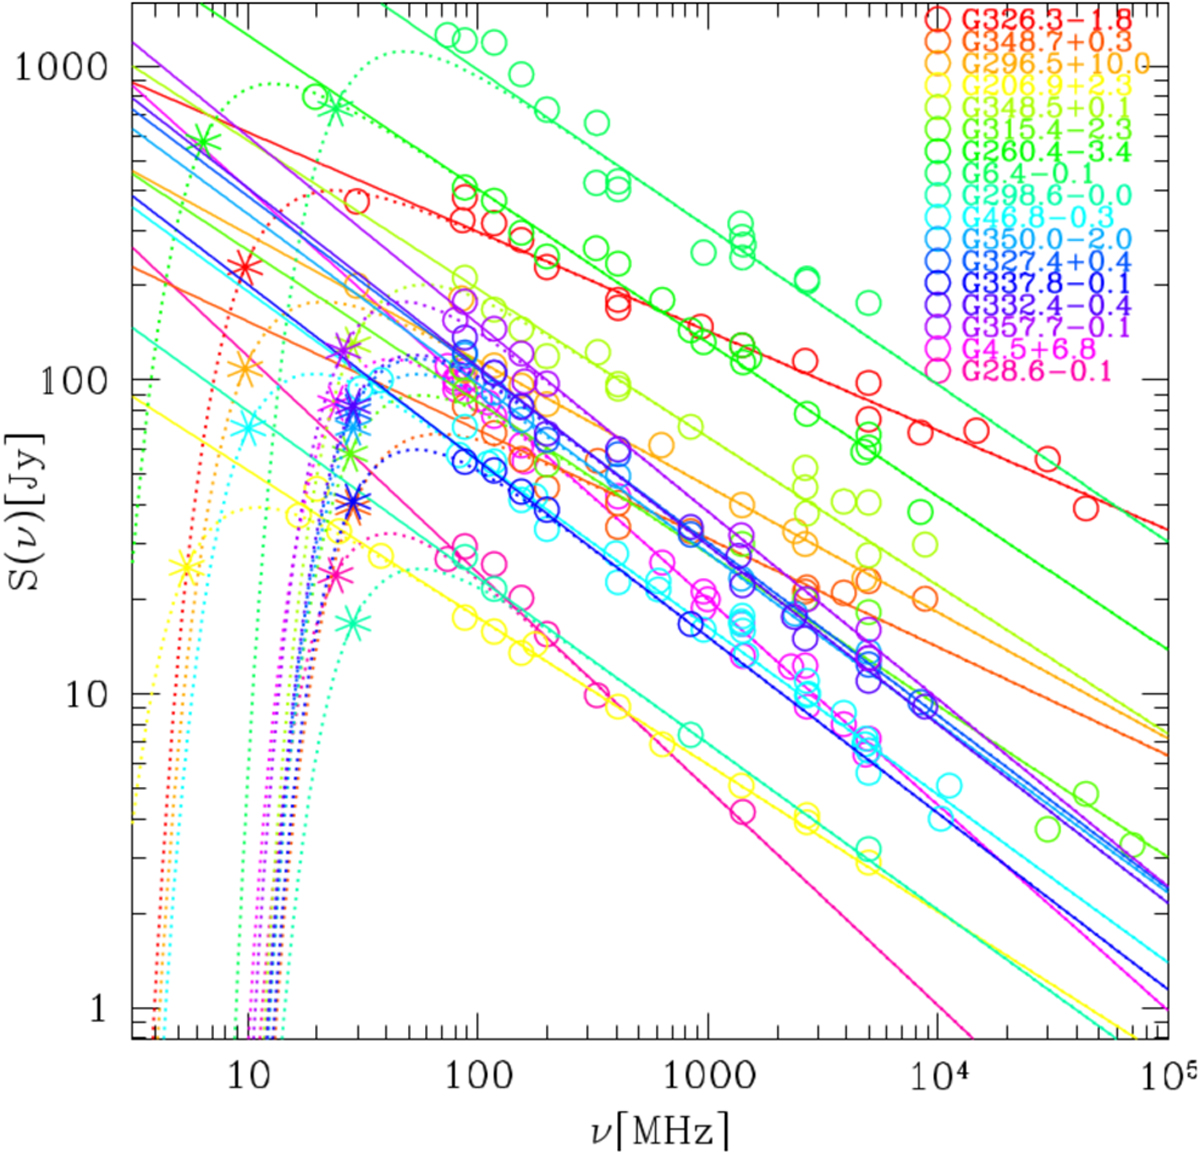
Radio flux density measurements (coloured open circles) as a function of frequency for 17 SNRs spectra without turnovers (see labels). This sample includes the spectra of SNRs G4.5+6.8 and G28.6-0.1 published in Castelletti et al. (2021) plus 15 new ones constructed for this work. The solid coloured lines shows each corresponding power-law best fit, while the dotted ones correspond to Eq. (2) with a characteristic frequency v, (see asterisk symbol) assigned as an upper limit according to the lowest measured frequency, vlow.
Current usage metrics show cumulative count of Article Views (full-text article views including HTML views, PDF and ePub downloads, according to the available data) and Abstracts Views on Vision4Press platform.
Data correspond to usage on the plateform after 2015. The current usage metrics is available 48-96 hours after online publication and is updated daily on week days.
Initial download of the metrics may take a while.