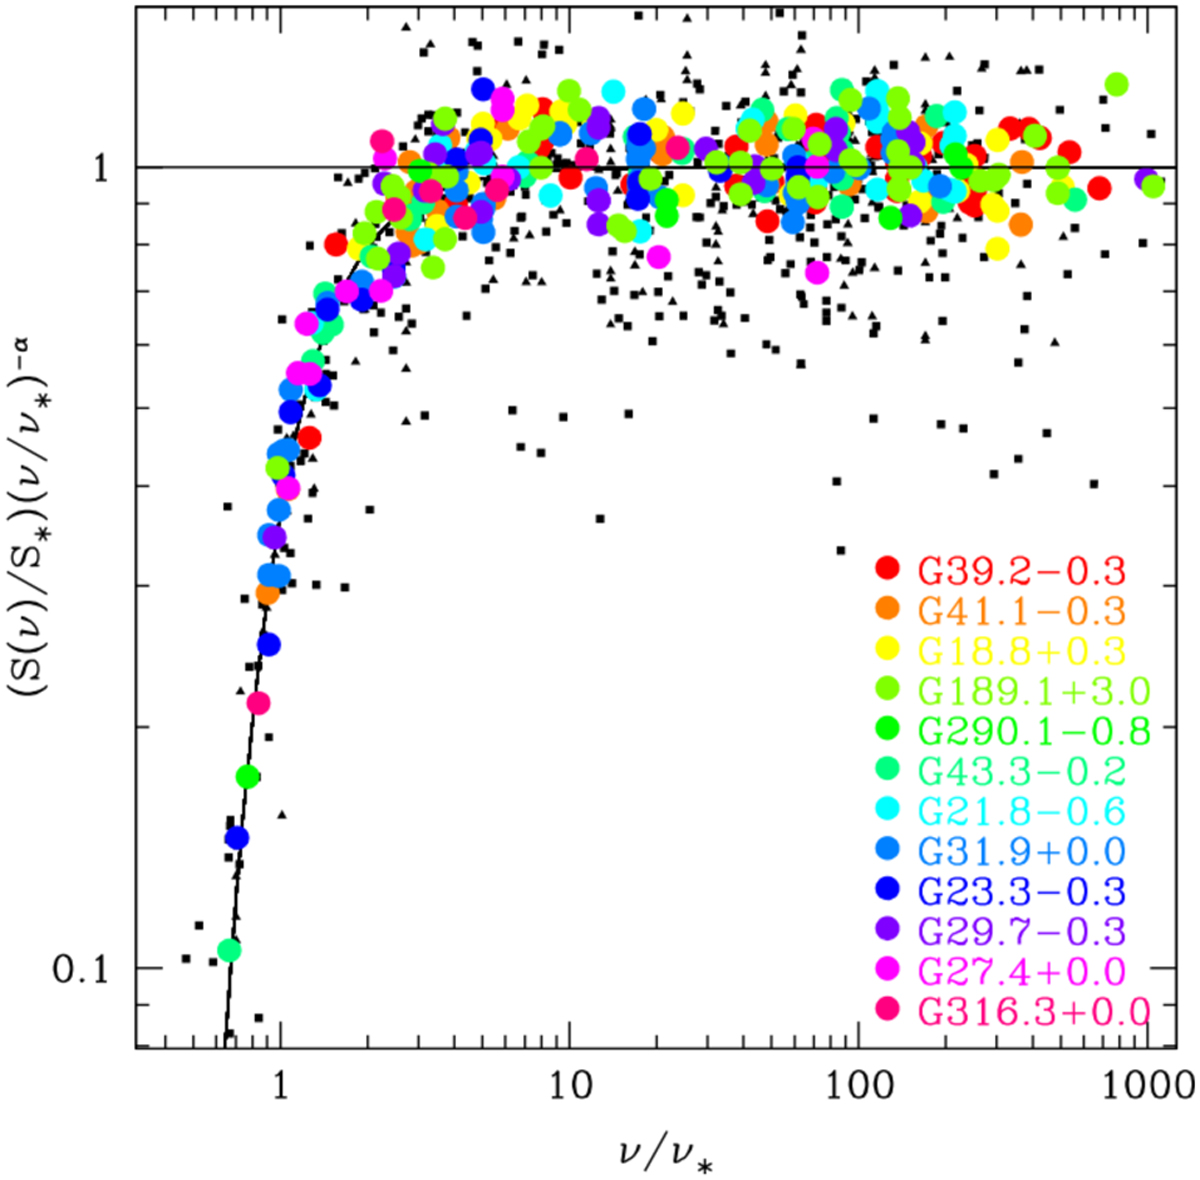
Fig. 3
Download original image
Normalised radio flux density measurement as a function of frequency for 9 SNR spectra presented in Castelletti et al. (2021) plus 3 new spectra for the SNRs G189.1+3.0, G290.1−0.8, and G316.3+0.0, constructed for this work (coloured filled circles), along with data from Kovalenko et al. (1994b) (black filled squares) and Kassim (1989) (black filled triangles). In order to highlight the drop-off behavior, the data are normalised to the power-law emission E(x) = xα, where x = ν/ν*. The curved solid line is the normalised absorption A(x) = exp(−x−2.1). The total root mean square (rms) of the coloured circles is less than 11%. At ν ~ 2.75ν, approximately 50% of the emission is absorbed.
Current usage metrics show cumulative count of Article Views (full-text article views including HTML views, PDF and ePub downloads, according to the available data) and Abstracts Views on Vision4Press platform.
Data correspond to usage on the plateform after 2015. The current usage metrics is available 48-96 hours after online publication and is updated daily on week days.
Initial download of the metrics may take a while.