Fig. 1
Download original image
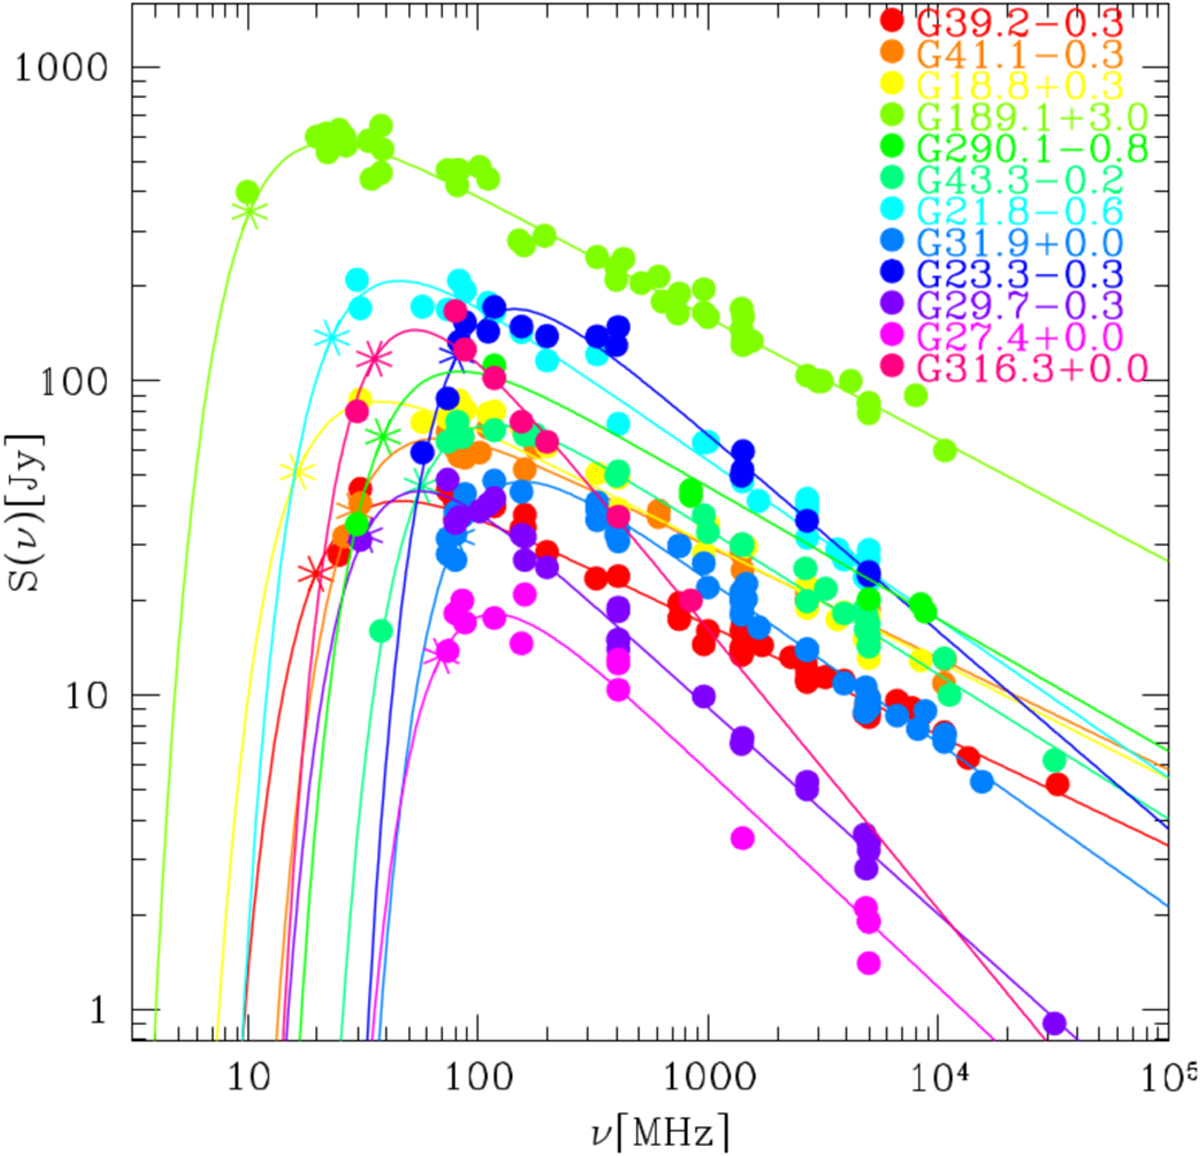
Radio flux density measurements (coloured filled circles) as a function of frequency for 12 SNRs spectra with turnovers (see labels). This sample is built of 9 SNR spectra reported in Castelletti et al. (2021) plus 3 new spectra for the SNRs G189.1+3.0, G290.1–0.8, and G316.3+0.0, which were specifically constructed for this work. The solid coloured lines shows each corresponding best fit given by Eq. (2) with parameters included in our Table A.1. The asterisk symbol indicates the individual characteristic frequency, v*
Current usage metrics show cumulative count of Article Views (full-text article views including HTML views, PDF and ePub downloads, according to the available data) and Abstracts Views on Vision4Press platform.
Data correspond to usage on the plateform after 2015. The current usage metrics is available 48-96 hours after online publication and is updated daily on week days.
Initial download of the metrics may take a while.