Fig. 9.
Download original image
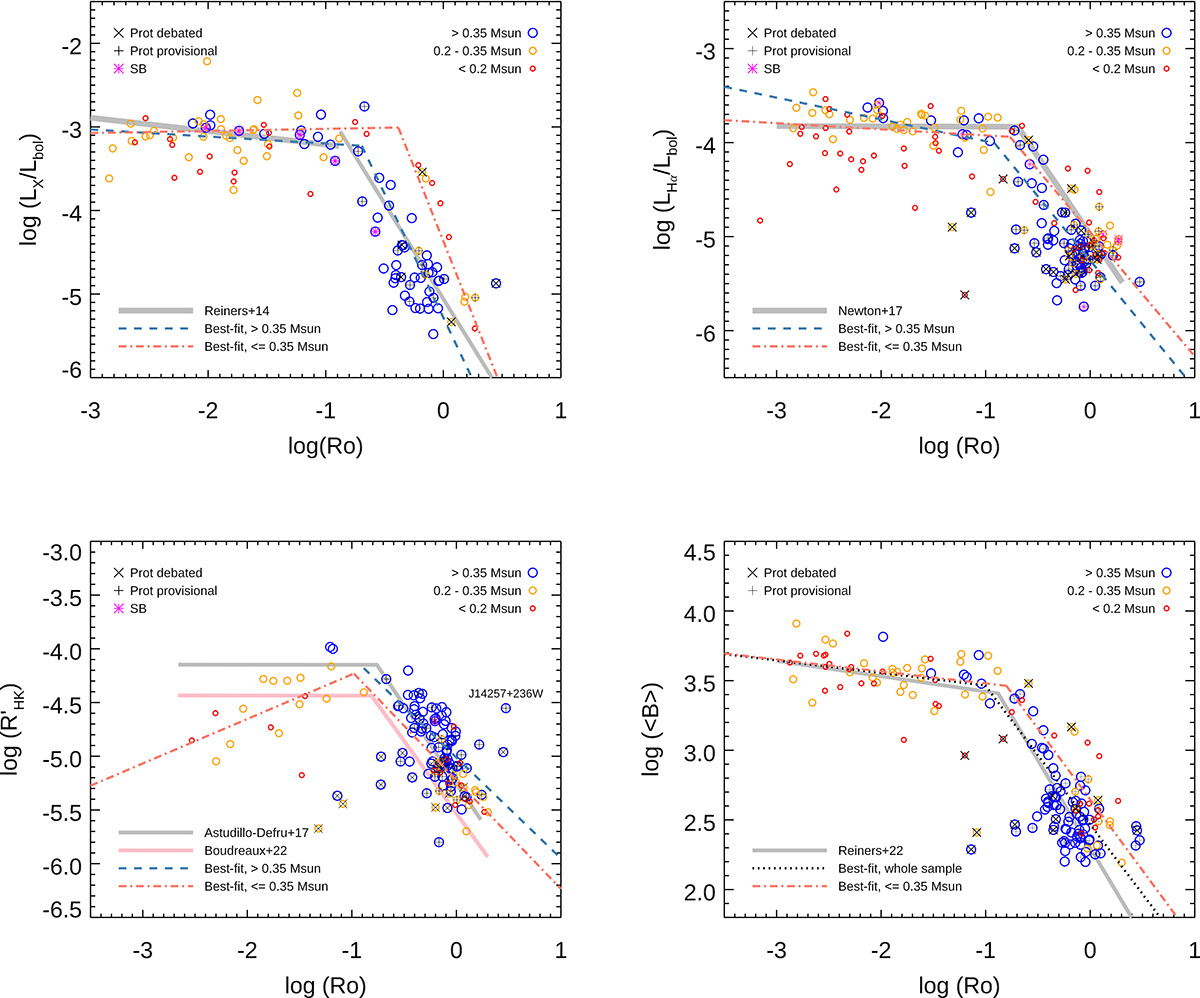
Rotation–activity relations studied for our sample, as discussed in Sect. 5.1. Top left: normalized X-ray luminosity LX/Lbol as function of the Rossby number Ro for 113 M dwarfs. The corresponding best-fit relation from Reiners et al. (2014) is plotted in thick grey lines. Top right: normalized Hα luminosity LHα/Lbol as function of Ro for 196 M dwarfs. The best-fit broken power-law relation from Newton et al. (2017) is displayed in grey. Bottom left: normalized Ca II H&K emission (![]() ) as function of Ro for 144 stars. The marked outlier J14257+236W was not included in our fit. Best-fit relations from Astudillo-Defru et al. (2017a) and Boudreaux et al. (2022) are overplotted. Bottom right: average magnetic field strength ⟨B⟩ versus Ro for 162 stars. In all plots, earlier-, mid-, and later-type M dwarfs (i.e., M⋆ > 0.35 M⊙, 0.35 M⊙ > M⋆ > 0.2 M⊙, < 0.2 M⊙) are denoted by large blue, medium-sized orange, and small red circles, respectively. Stars with non-debated period values are fitted with broken power laws, shown in broken dashed lines in black (whole sample), blue (> 0.35M⊙), and green (≤0.35 M⊙). Stars with debated periods are marked by black ‘X’s, and with provisional periods they are marked by black ‘+’s. Known SBs are represented by magenta asterisks. Where applicable, best-fit rotation-activity relations for subsamples within defined mass ranges are overlaid (black dotted lines: whole sample, blue dashed lines: > 0.35 M⊙, red dash-dotted lines: ≤0.35 M⊙).
) as function of Ro for 144 stars. The marked outlier J14257+236W was not included in our fit. Best-fit relations from Astudillo-Defru et al. (2017a) and Boudreaux et al. (2022) are overplotted. Bottom right: average magnetic field strength ⟨B⟩ versus Ro for 162 stars. In all plots, earlier-, mid-, and later-type M dwarfs (i.e., M⋆ > 0.35 M⊙, 0.35 M⊙ > M⋆ > 0.2 M⊙, < 0.2 M⊙) are denoted by large blue, medium-sized orange, and small red circles, respectively. Stars with non-debated period values are fitted with broken power laws, shown in broken dashed lines in black (whole sample), blue (> 0.35M⊙), and green (≤0.35 M⊙). Stars with debated periods are marked by black ‘X’s, and with provisional periods they are marked by black ‘+’s. Known SBs are represented by magenta asterisks. Where applicable, best-fit rotation-activity relations for subsamples within defined mass ranges are overlaid (black dotted lines: whole sample, blue dashed lines: > 0.35 M⊙, red dash-dotted lines: ≤0.35 M⊙).
Current usage metrics show cumulative count of Article Views (full-text article views including HTML views, PDF and ePub downloads, according to the available data) and Abstracts Views on Vision4Press platform.
Data correspond to usage on the plateform after 2015. The current usage metrics is available 48-96 hours after online publication and is updated daily on week days.
Initial download of the metrics may take a while.