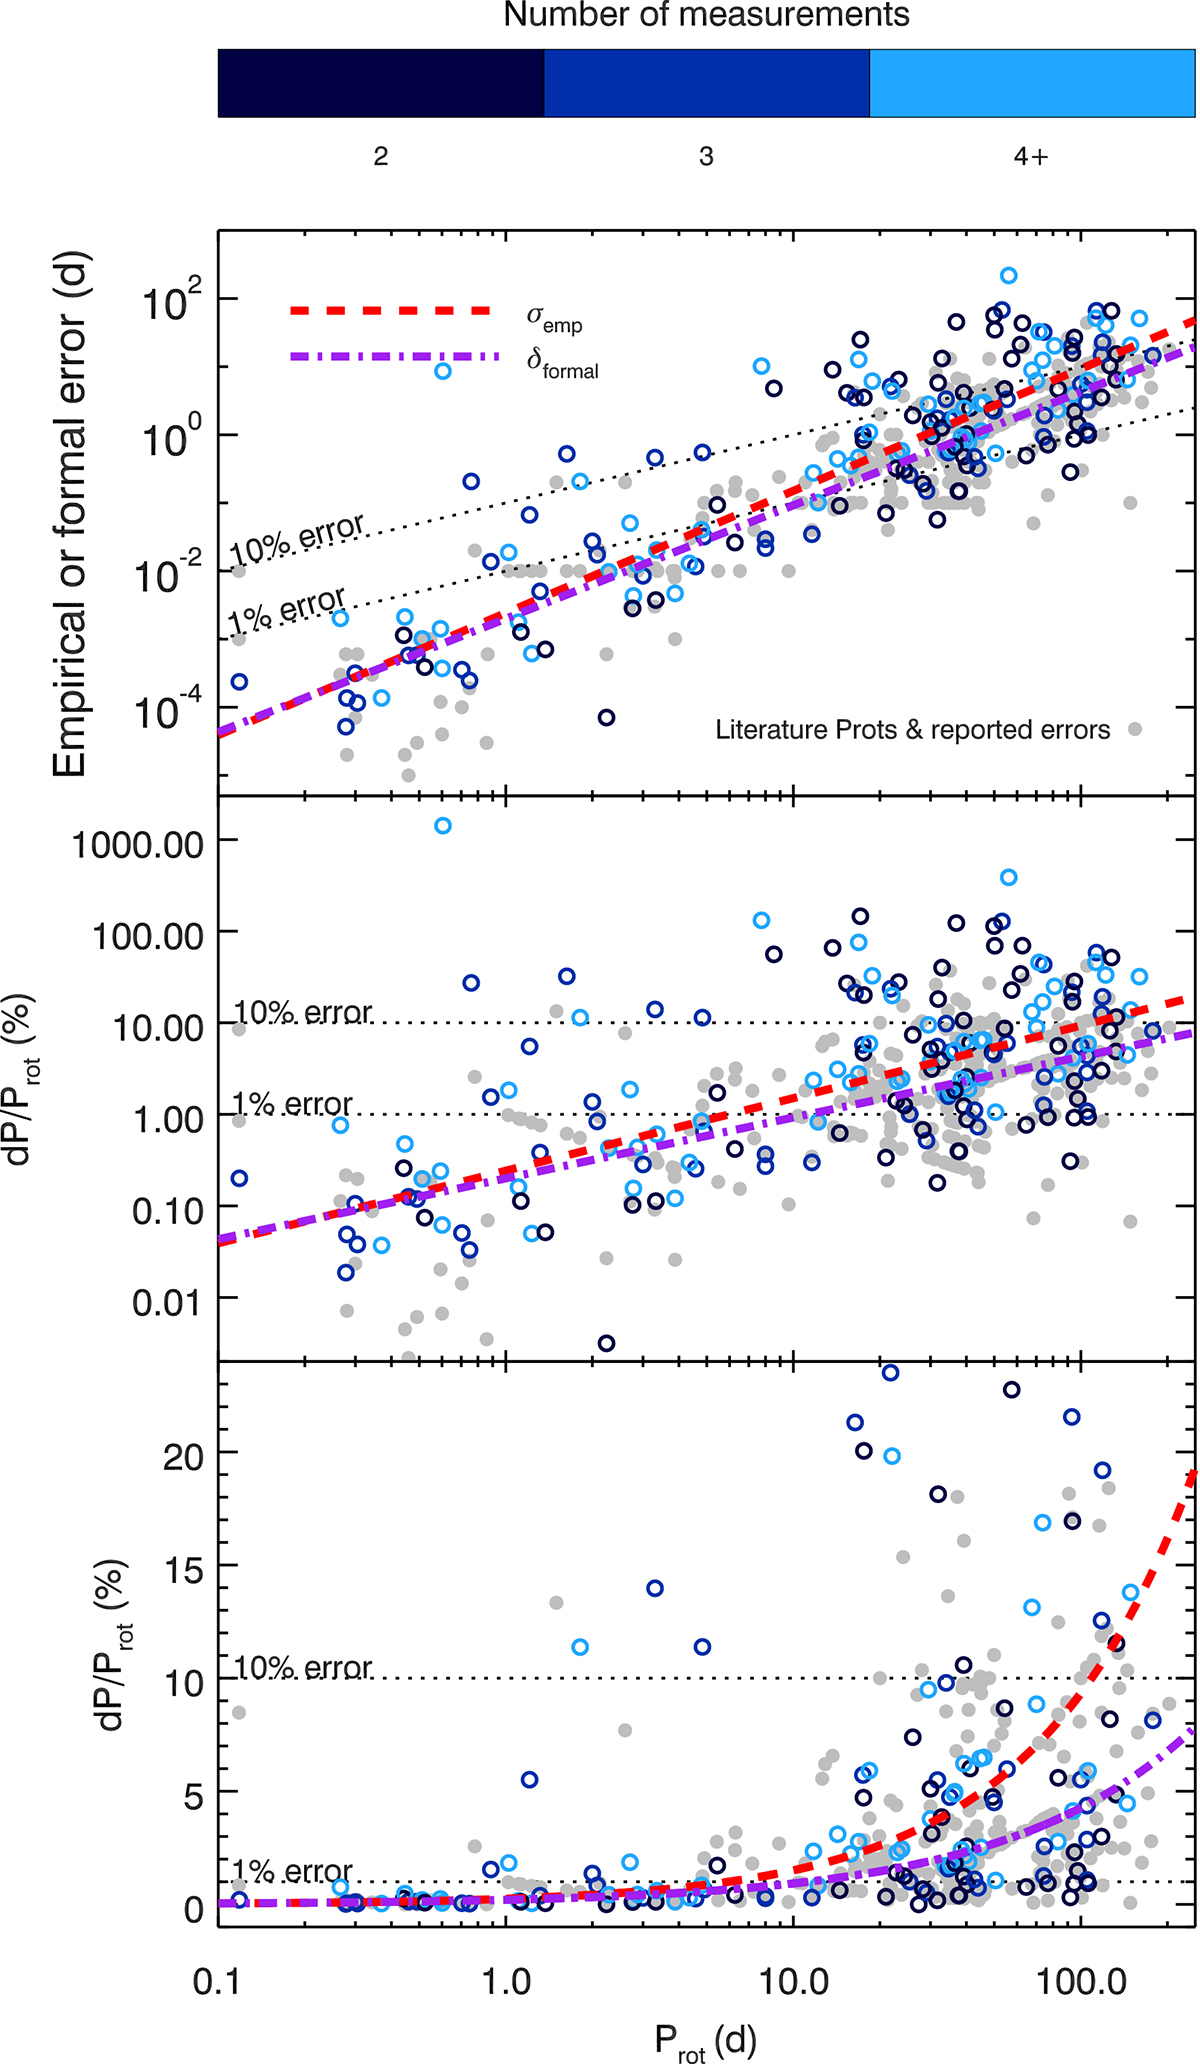
Fig. 7.
Download original image
Measures of error as a function of Prot. Blue unfilled circles plot the ‘empirical’ dispersion σemp, i.e., standard deviation of the measured periods, colour-coded by the number of measurements (see colour bar). Grey filled circles represent ‘formal’ errors δformal, as reported in the literature. Top: σemp versus Prot, best (blue) and δformal versus reported Prot (grey); middle: fractional error versus Prot, where fractional error is obtained by dividing σemp or δformal (collectively termed ‘dP’) by Prot. Bottom: same as the middle, but with the y-axis shown on a linear scale. The best-fit power laws are plotted for σemp (red dashed, as given in Eq. (4)) and δformal (purple dot-dashed, as given in Eq. (5)). The black dotted lines depict constant fractional errors of 10% and 1% for comparison. Note that the bottom panel has restricted vertical plotting range in order to show the difference in the two power laws. Points beyond the vertical range are not shown.
Current usage metrics show cumulative count of Article Views (full-text article views including HTML views, PDF and ePub downloads, according to the available data) and Abstracts Views on Vision4Press platform.
Data correspond to usage on the plateform after 2015. The current usage metrics is available 48-96 hours after online publication and is updated daily on week days.
Initial download of the metrics may take a while.