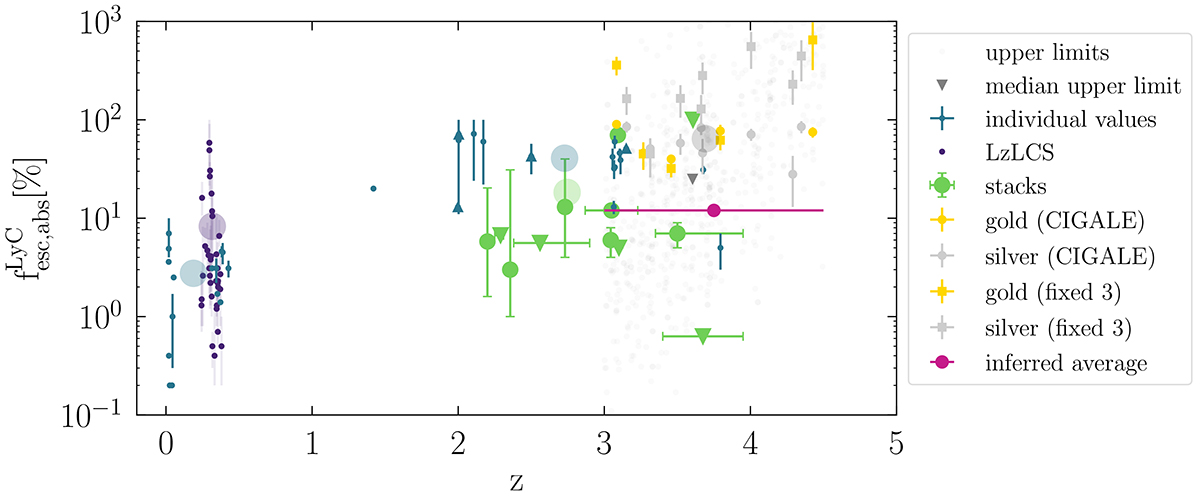
Fig. 9.
Download original image
Logarithmic absolute escape fraction of LyC over redshift for a collection of literature values and our sample of gold and silver objects, in their respective colours. Here, circles show measurements from SED fitting using CIGALE, while squares are escape fractions using an intrinsic ratio of 3 to compare to the literature. The small blue dots represent individual detections of LyC emission, for low-redshift analogues and high redshifts. The small purple dots are from the LzLCS survey (Flury et al. 2022a,b). The large green symbols indicate results from stacking analyses. Stacks, where only upper or lower limits could be estimated, are shown with downwards-facing and upwards-facing triangles, respectively. The large transparent circles are the mean values of the respective sub-sample, with the grey containing both the gold and silver samples. The light grey dots between z = 3 − 4.5 are the upper limits of our sample (based on an intrinsic ratio of 3), and the grey downward triangle is the median of those upper limits. The magenta dot corresponds to the inferred average escape fraction from the simulations described in Sect. 6.3. The data shown are based on Tables B.1–B.3.
Current usage metrics show cumulative count of Article Views (full-text article views including HTML views, PDF and ePub downloads, according to the available data) and Abstracts Views on Vision4Press platform.
Data correspond to usage on the plateform after 2015. The current usage metrics is available 48-96 hours after online publication and is updated daily on week days.
Initial download of the metrics may take a while.