Fig. 7.
Download original image
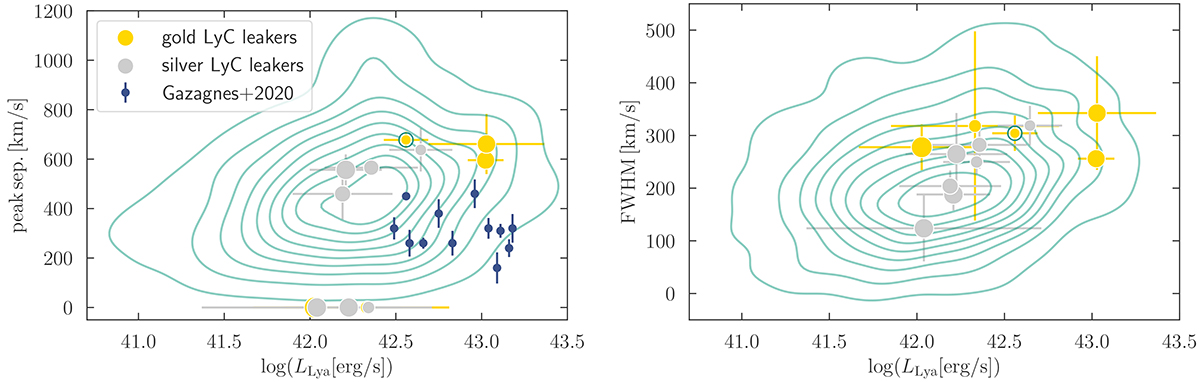
Comparison between the logarithmic Lyα luminosity and two Lyα line properties. Left: peak separation of the Lyα line as a function of the logarithmic Lyα luminosity. The contours (each showing a 10% number difference) contain the full sample of LAEs from Kerutt et al. (2022) and show the density of objects in the peak separation and Lyα luminosity plane. The gold and silver dots show the individual values for the LyC leaker candidates, with the sizes indicating the escape fraction values based on the SED models by CIGALE. The gold candidate with a green circle is the object already discovered in Saxena et al. (2022) and discussed in Rivera-Thorsen et al. (2022). Objects without double peaks are placed at peak sep. = 0 at their respective luminosities. The blue dots show data of low redshift LyC leakers from Gazagnes et al. (2020), also featured in Izotov et al. (2016a,b, 2018a,b), and Maji et al. (2022). Right: FWHM of the Lyα line as a function of the logarithmic Lyα luminosity, again with contours showing the distribution of objects in these values.
Current usage metrics show cumulative count of Article Views (full-text article views including HTML views, PDF and ePub downloads, according to the available data) and Abstracts Views on Vision4Press platform.
Data correspond to usage on the plateform after 2015. The current usage metrics is available 48-96 hours after online publication and is updated daily on week days.
Initial download of the metrics may take a while.