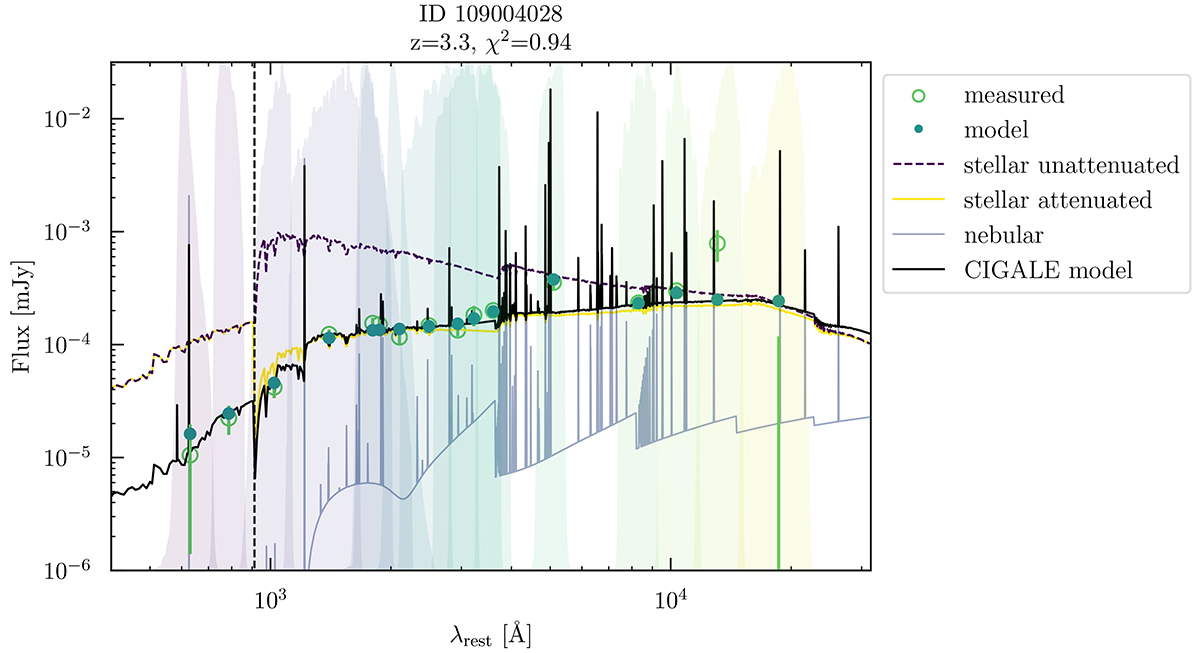
Fig. 5.
Download original image
Example of an SED fit using CIGALE (modified CIGALE plot using the output files). The x-axis shows the logarithmic rest-frame wavelength in Angstrom, the y-axis shows the logarithmic flux in micro Jansky. The purple dashed line shows the stellar unattenuated emission and the yellow line shows the stellar emission taking dust into account. The light blue line shows nebular emission and the solid black line shows the composite CIGALE model fit. The empty green dots are the measured values in the individual filter bands (shown as transparent areas in different colours from purple to yellow) and the dark green dots show the model values in the same filter bands. The vertical dashed line indicates the LyC break at 912 Å. The object ID, redshift, and reduced χ2 are written on the top.
Current usage metrics show cumulative count of Article Views (full-text article views including HTML views, PDF and ePub downloads, according to the available data) and Abstracts Views on Vision4Press platform.
Data correspond to usage on the plateform after 2015. The current usage metrics is available 48-96 hours after online publication and is updated daily on week days.
Initial download of the metrics may take a while.