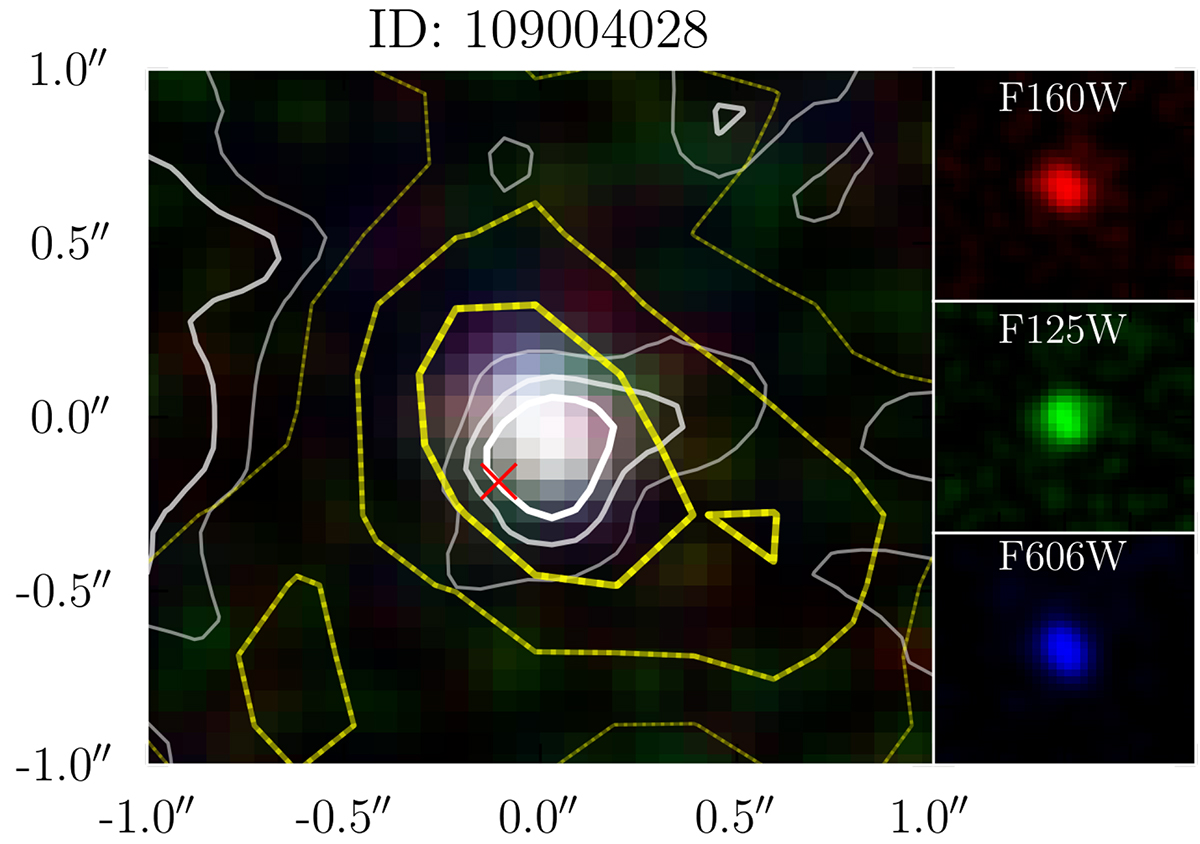
Fig. 3.
Download original image
RGB image for one of the LyC leaker candidates. The three images that were combined for the main image are shown to the right of each pane and are the HST bands WFC3/IR F160W (red), F125W (green) and ACS F606W (blue). The white contours in the main panels show the signal in HST band WFC3/UVIS F336W, where the LyC emission can be found. The contours show SN of 3, 2 and 1 (strongest to lightest) for an image smoothed with a Gaussian kernel of σ = 1 pixel. The yellow dotted contours show the extent of the Lyα emission in the MUSE data, also smoothed with a Gaussian kernel of σ = 1 pixel. It has to be kept in mind that the PSF of MUSE is larger than that of HST. However, it has been shown that Lyα emission is usually ten times more extended than the UV continuum (e.g. Wisotzki et al. 2016, 2018; Leclercq et al. 2017). The red cross in the main panel shows the position of the pixel with the highest S/N in the Lyα emission found with MUSE.
Current usage metrics show cumulative count of Article Views (full-text article views including HTML views, PDF and ePub downloads, according to the available data) and Abstracts Views on Vision4Press platform.
Data correspond to usage on the plateform after 2015. The current usage metrics is available 48-96 hours after online publication and is updated daily on week days.
Initial download of the metrics may take a while.