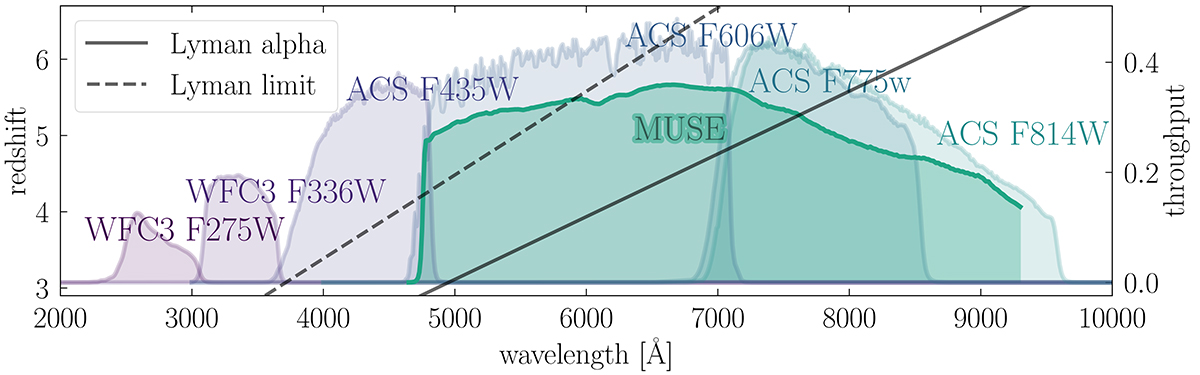
Fig. 2.
Download original image
HST bands and MUSE throughput used in this study. The x-axis shows the observed wavelength in Å, the left y-axis shows the redshift and corresponds to the black dashed and solid lines, and the right y-axis shows the filter throughput and corresponds to the coloured filter curves. The solid line shows where the Lyα line would fall depending on redshift, and the dashed line shows the Lyman limit at 912 Å, delimiting the LyC, which is bluewards of this line. Only the redshift range where Lyα is visible for MUSE is shown. The two bands with the lowest wavelengths (WFC3/UVIS F275W and F336W) are from the HDUV legacy survey and are used in this study to identify LyC emission.
Current usage metrics show cumulative count of Article Views (full-text article views including HTML views, PDF and ePub downloads, according to the available data) and Abstracts Views on Vision4Press platform.
Data correspond to usage on the plateform after 2015. The current usage metrics is available 48-96 hours after online publication and is updated daily on week days.
Initial download of the metrics may take a while.