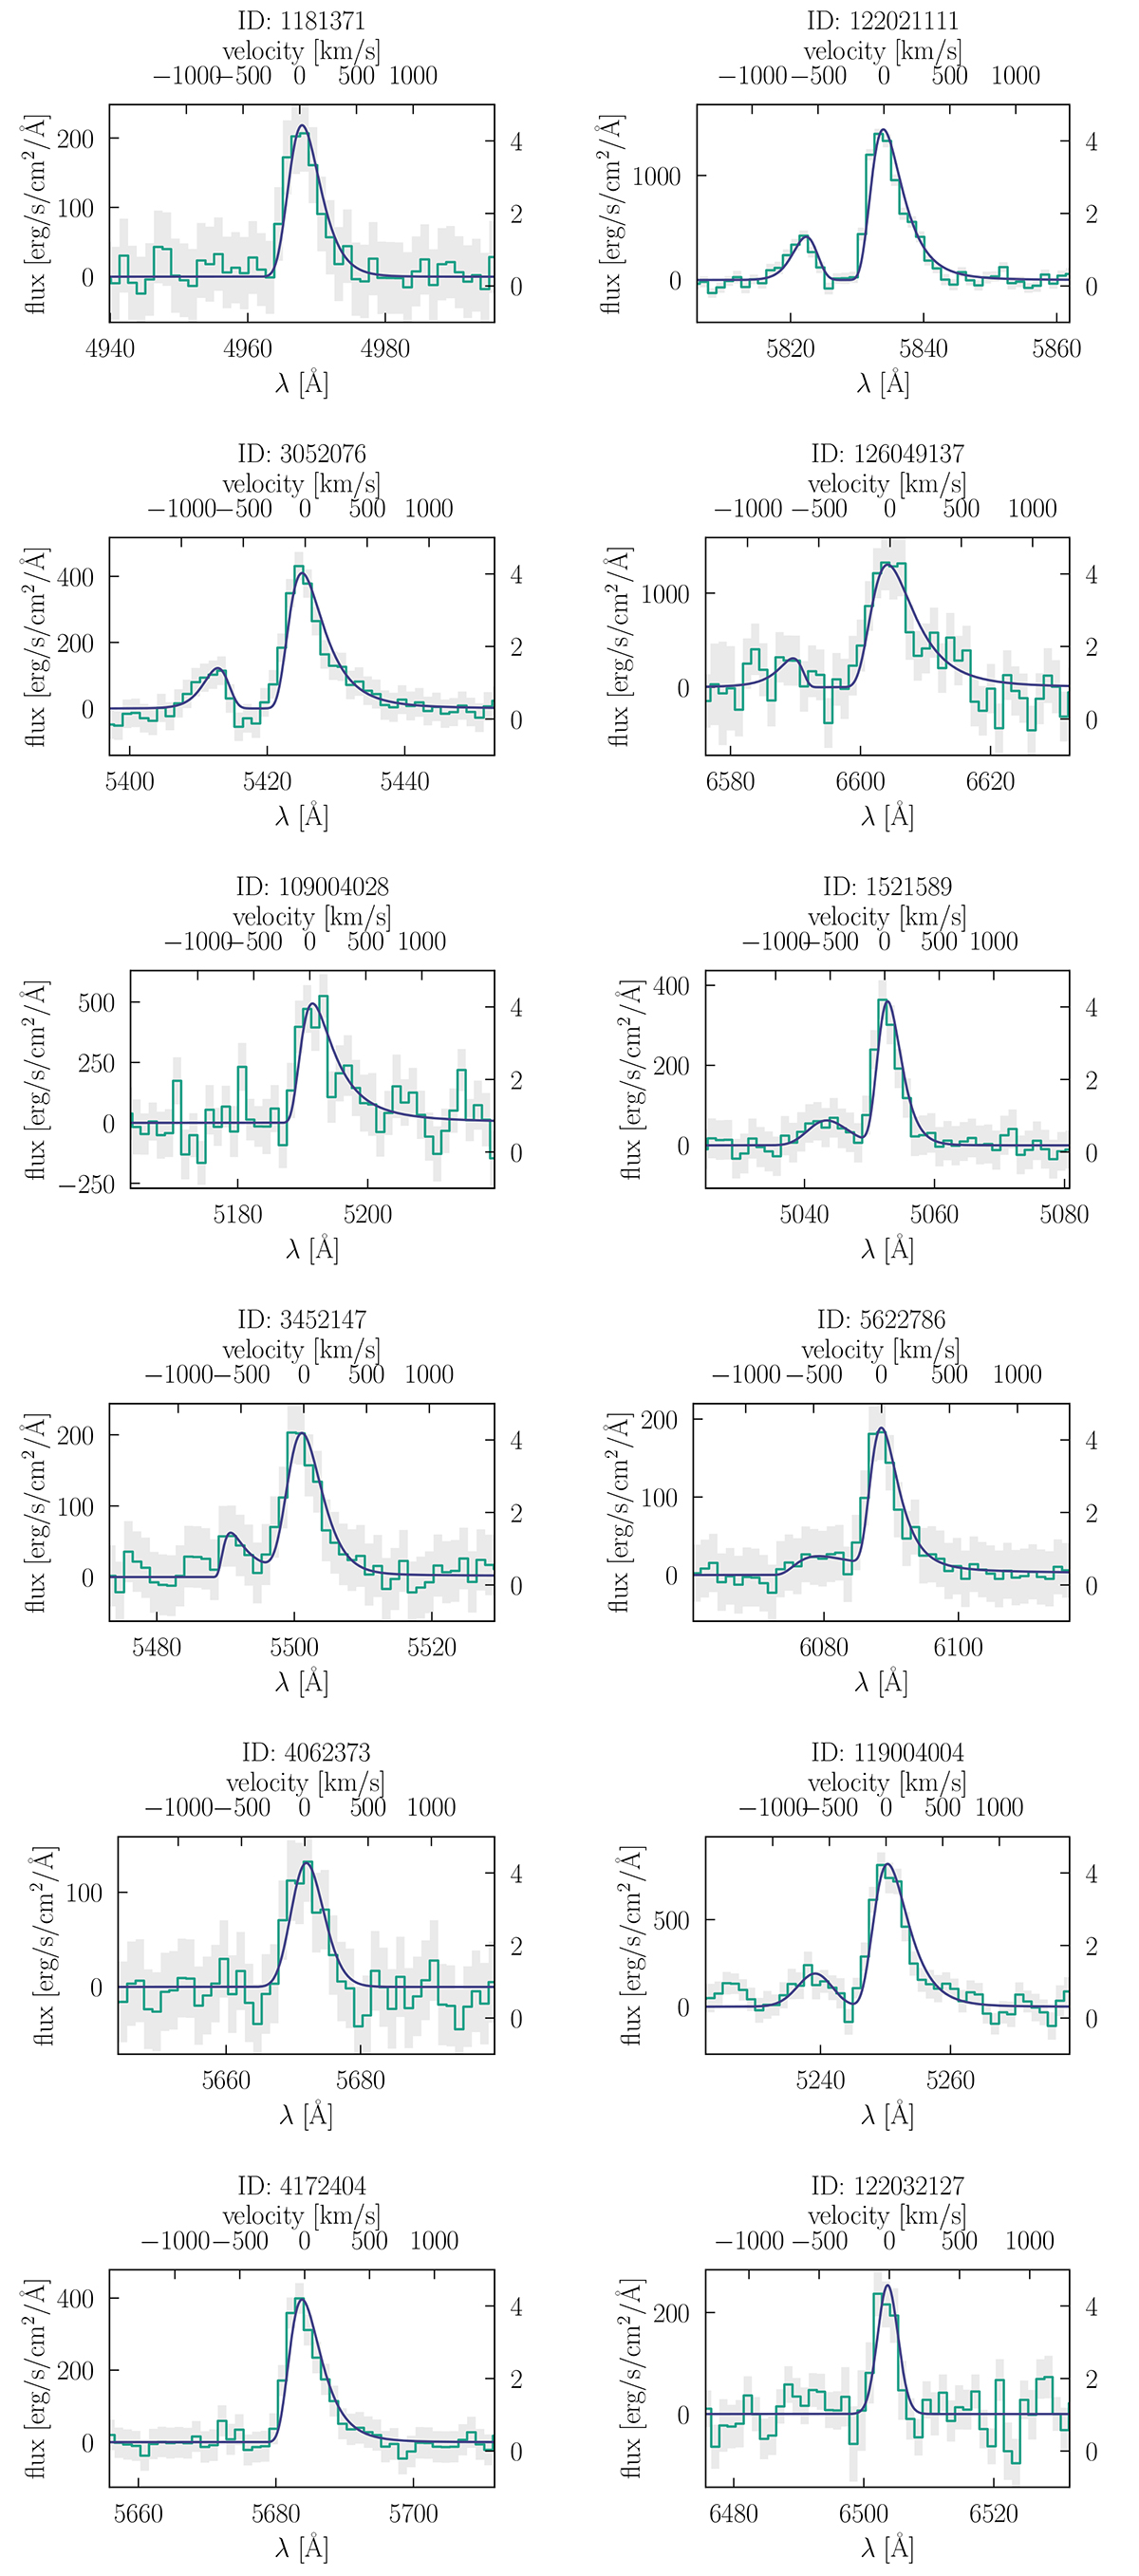
Fig. A.1.
Download original image
Spectra from MUSE-Wide for the sample of LyC leaker candidates. The green line shows the data and the grey area shows the error range. The blue line shows the fit to the line consisting of one or two asymmetric Gaussians (see Shibuya et al. 2014 and Kerutt et al. 2022). Note that while the x-axis always shows a range of 50 Å around the Lyα line, the y-axis range scales with the amplitude of the line.
Current usage metrics show cumulative count of Article Views (full-text article views including HTML views, PDF and ePub downloads, according to the available data) and Abstracts Views on Vision4Press platform.
Data correspond to usage on the plateform after 2015. The current usage metrics is available 48-96 hours after online publication and is updated daily on week days.
Initial download of the metrics may take a while.