Fig. 11.
Download original image
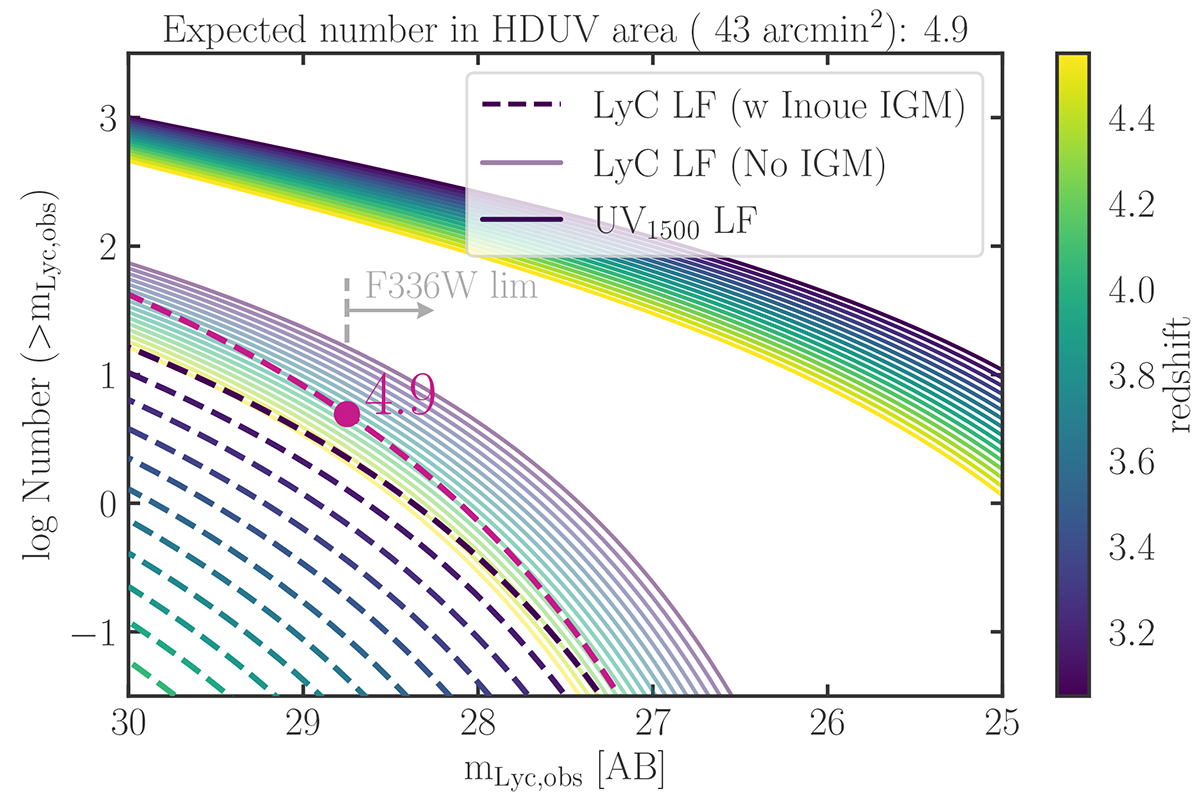
Expected number of LyC leakers (logarithmic, y-axis) versus observed LyC AB magnitude. The thick, solid lines show the UV LF (the number of objects expected in the HDUV area at the given redshift), while the thin, solid lines show the predicted LyC LF, both colour-coded for different redshifts (see colour bar). The dashed lines indicate the expected number at different redshifts, using IGM transmission lines from Inoue et al. (2014) and assuming an escape fraction of 12%. The colours show redshifts from 3.0 to 4.5 in redshift bins of Δz = 0.1, which are all added up for the pink dashed line. The pink dot marks the expected number of LyC leaker candidates (4.9) for the HDUV area in GOODS-S (with a size of 43 arcmin2). This is given for the depth in the HST band F336W of ≈28.75 magAB, which corresponds roughly to a 3σ detection.
Current usage metrics show cumulative count of Article Views (full-text article views including HTML views, PDF and ePub downloads, according to the available data) and Abstracts Views on Vision4Press platform.
Data correspond to usage on the plateform after 2015. The current usage metrics is available 48-96 hours after online publication and is updated daily on week days.
Initial download of the metrics may take a while.