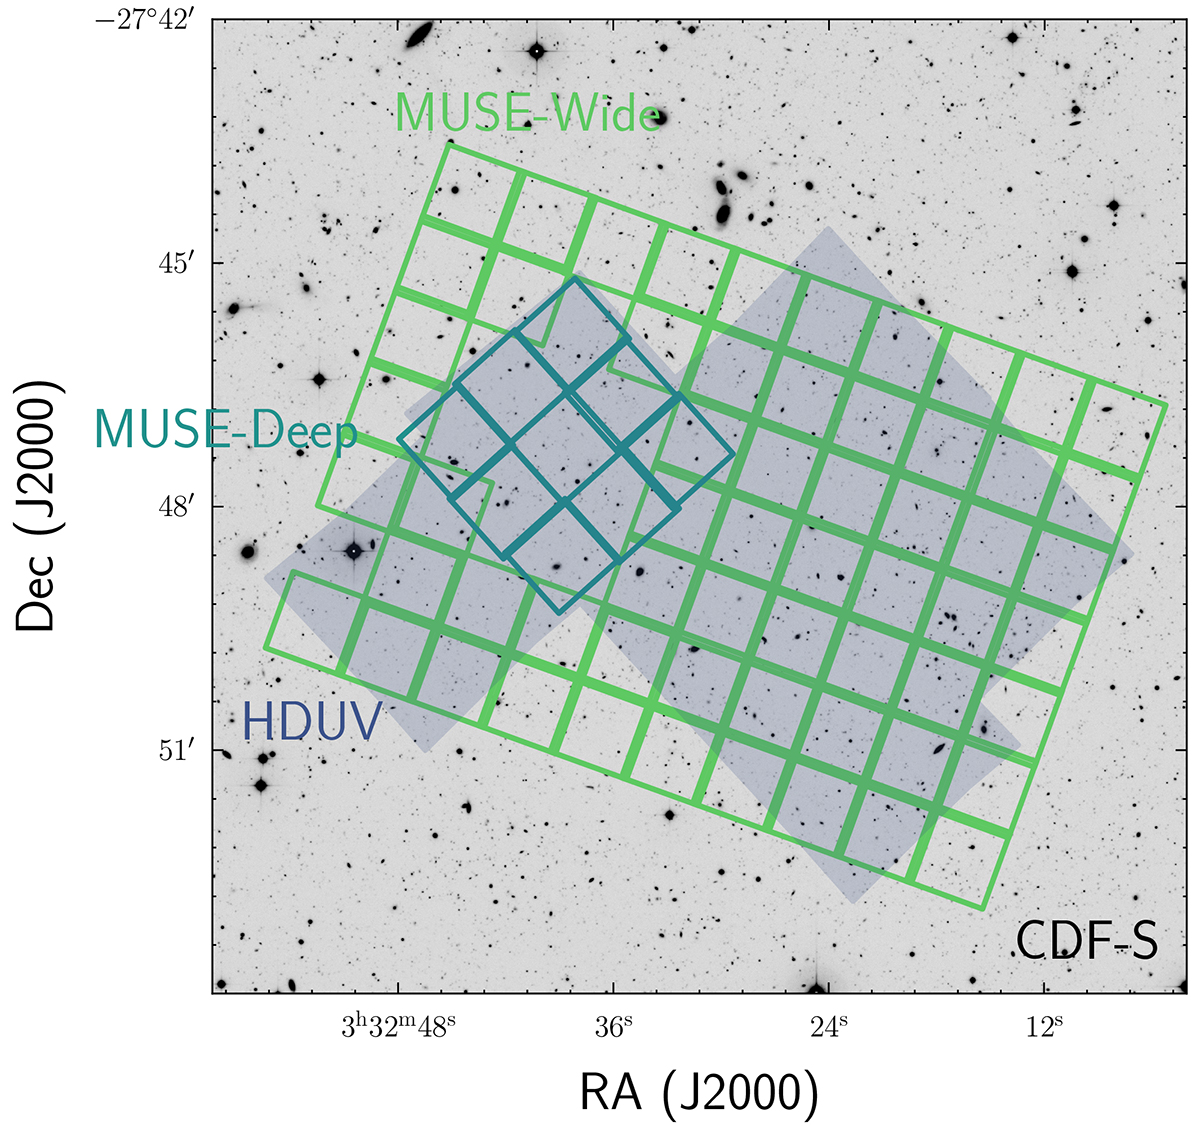
Fig. 1.
Download original image
Footprint of MUSE and HDUV pointings in the CDFS region. The background is a V-band image taken from the Garching-Bonn Deep Survey (GaBoDS, Hildebrandt et al. 2006). The 60 individual MUSE-Wide pointings relevant here are shown in bright green, and the nine MUSE-Deep fields (Bacon et al. 2017; Inami et al. 2017, also including the UDF 10) are marked blue. The HDUV footprint is shown as the blue shaded area and covers most of the MUSE-Wide fields as well as MUSE-Deep.
Current usage metrics show cumulative count of Article Views (full-text article views including HTML views, PDF and ePub downloads, according to the available data) and Abstracts Views on Vision4Press platform.
Data correspond to usage on the plateform after 2015. The current usage metrics is available 48-96 hours after online publication and is updated daily on week days.
Initial download of the metrics may take a while.