Fig. 9.
Download original image
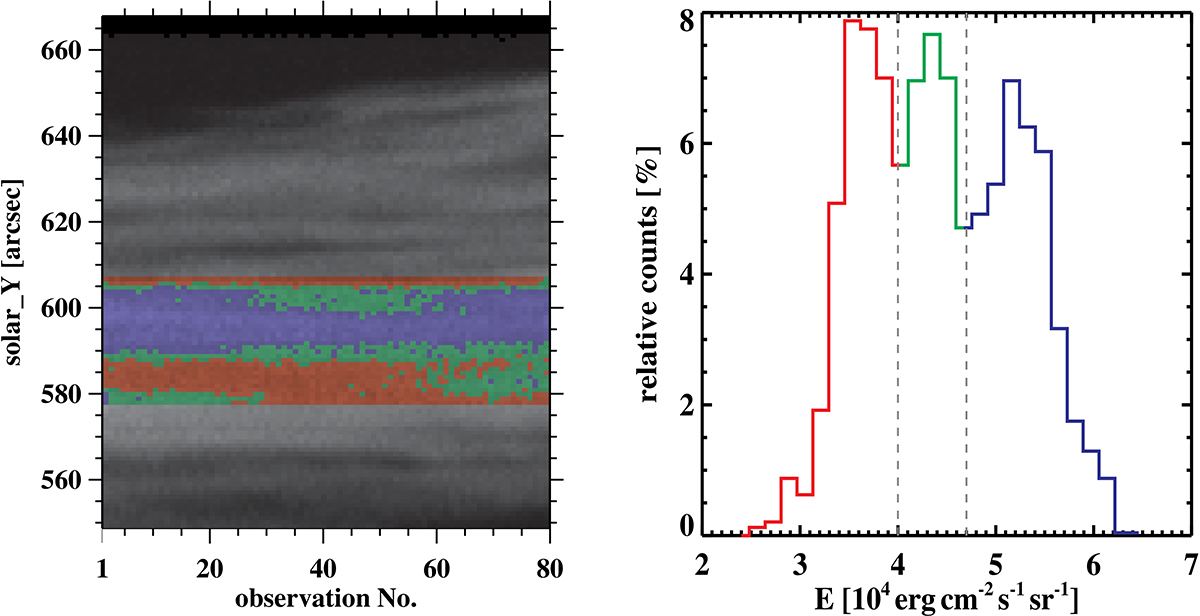
Map (left panel) showing the color mosaic of locations within the analyzed area with the Lyα integrated intensities belonging to the three peaks in the E histogram (right panel). Integrated intensities outside of the analyzed area are shown in shades of gray. The histogram constructed for all Lyα profiles is used (shown also in the upper left panel of Fig. A.1). Color coding in the mosaic corresponds to that used in the histogram: The red is for the left histogram peak, green for the middle, and blue for the right peak of the E histogram.
Current usage metrics show cumulative count of Article Views (full-text article views including HTML views, PDF and ePub downloads, according to the available data) and Abstracts Views on Vision4Press platform.
Data correspond to usage on the plateform after 2015. The current usage metrics is available 48-96 hours after online publication and is updated daily on week days.
Initial download of the metrics may take a while.