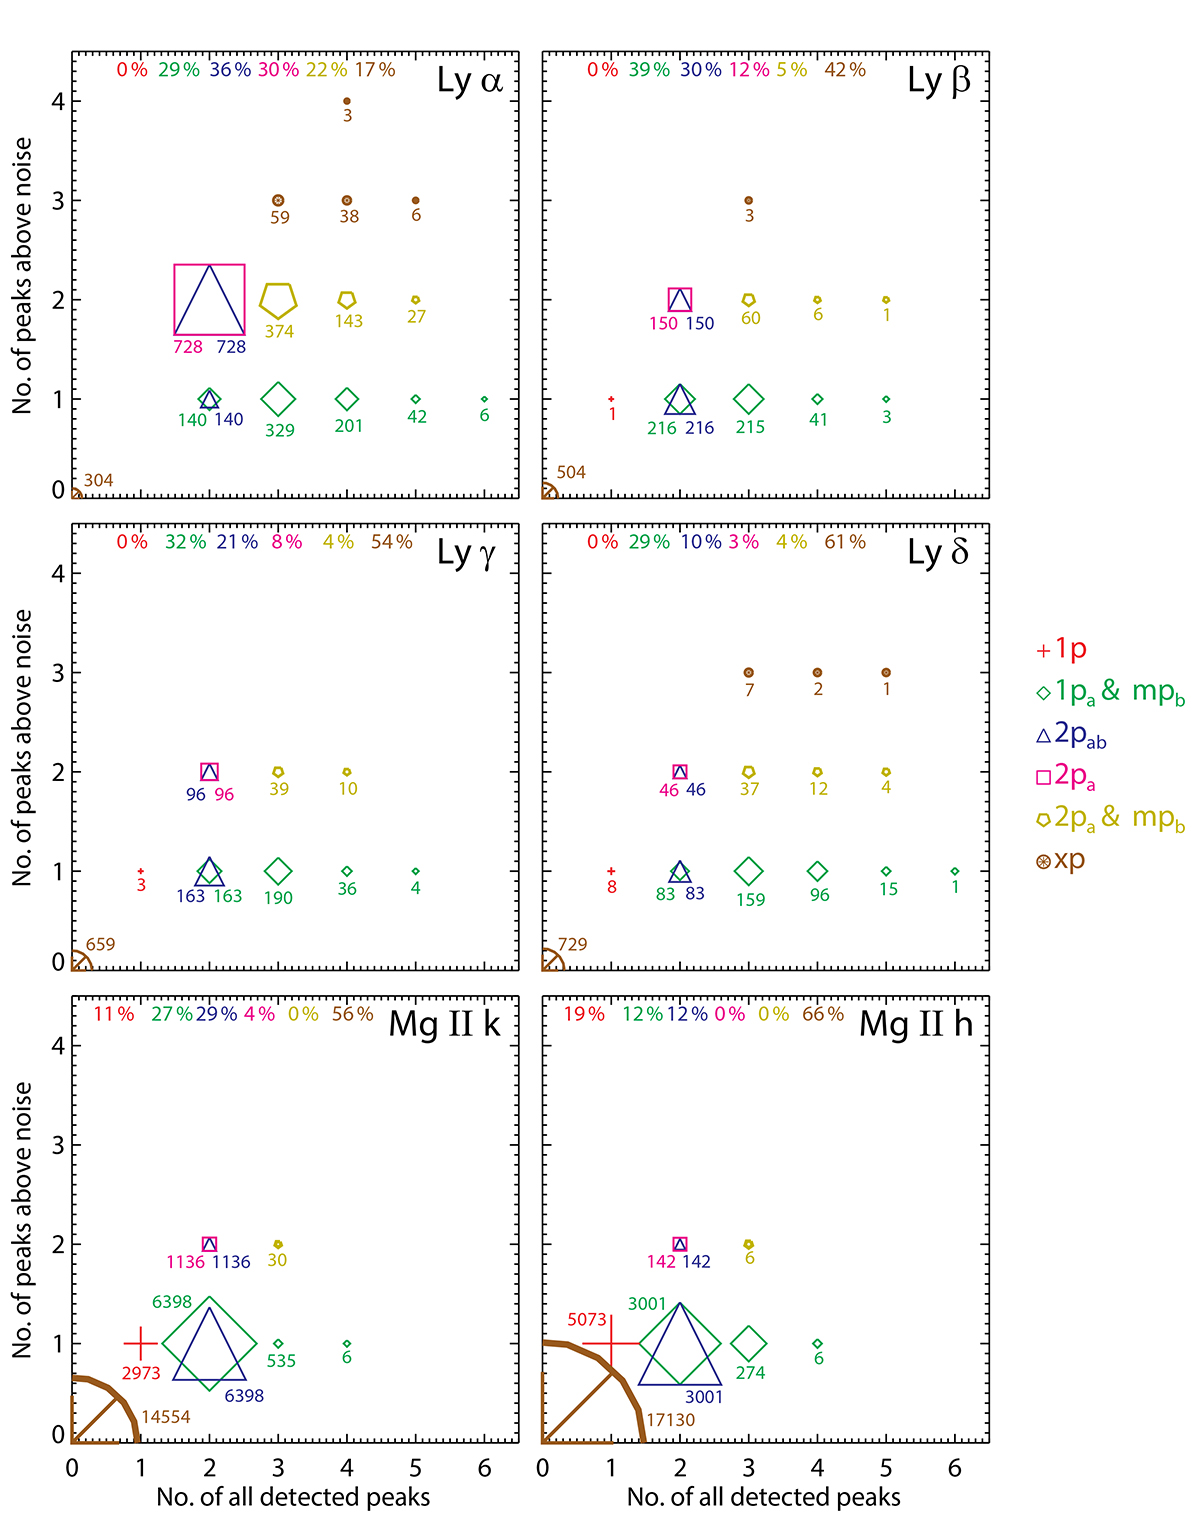
Fig. 8.
Download original image
Diagrams showing distributions of profiles of all six spectral lines in a space of the number of all of the detected peaks on the abscissa versus number of peaks above noise on the ordinate. Affiliations to the individual groups are indicated by different colors and symbols; the legend is located on the right. Sizes of the symbols are proportional to numbers of profiles in the individual positions and these numbers are also shown next to the symbols. Further information on the diagrams is given in the text.
Current usage metrics show cumulative count of Article Views (full-text article views including HTML views, PDF and ePub downloads, according to the available data) and Abstracts Views on Vision4Press platform.
Data correspond to usage on the plateform after 2015. The current usage metrics is available 48-96 hours after online publication and is updated daily on week days.
Initial download of the metrics may take a while.