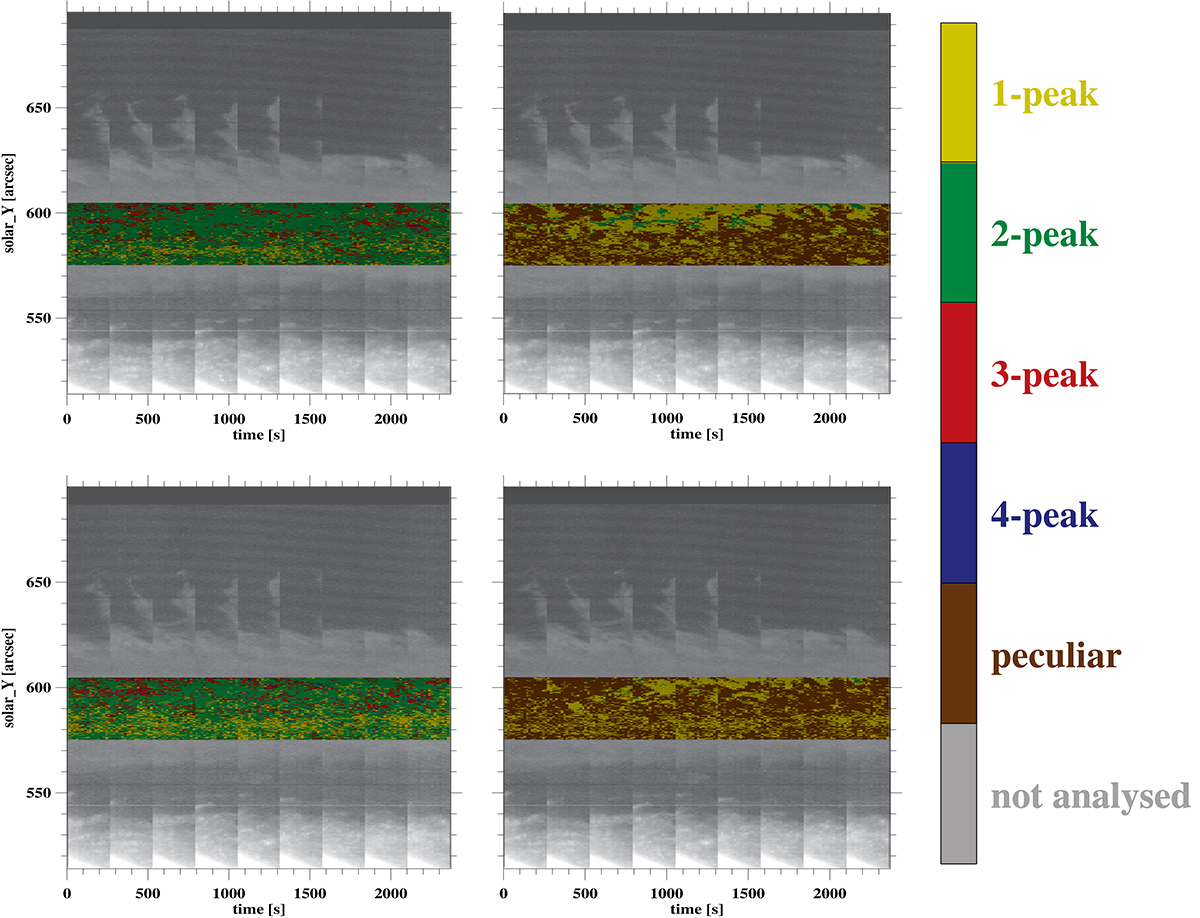
Fig. 6.
Download original image
Maps of the integrated intensities of the Mg II k (top row) and Mg II h lines (bottom row) overlaid with the colored mosaics classifying profile types (color bar on the right) within the target area. Here only the profile types from first nine rasters are classified regardless of noise (left column) and by considering only the peaks above error bars (right column).
Current usage metrics show cumulative count of Article Views (full-text article views including HTML views, PDF and ePub downloads, according to the available data) and Abstracts Views on Vision4Press platform.
Data correspond to usage on the plateform after 2015. The current usage metrics is available 48-96 hours after online publication and is updated daily on week days.
Initial download of the metrics may take a while.