Fig. 4.
Download original image
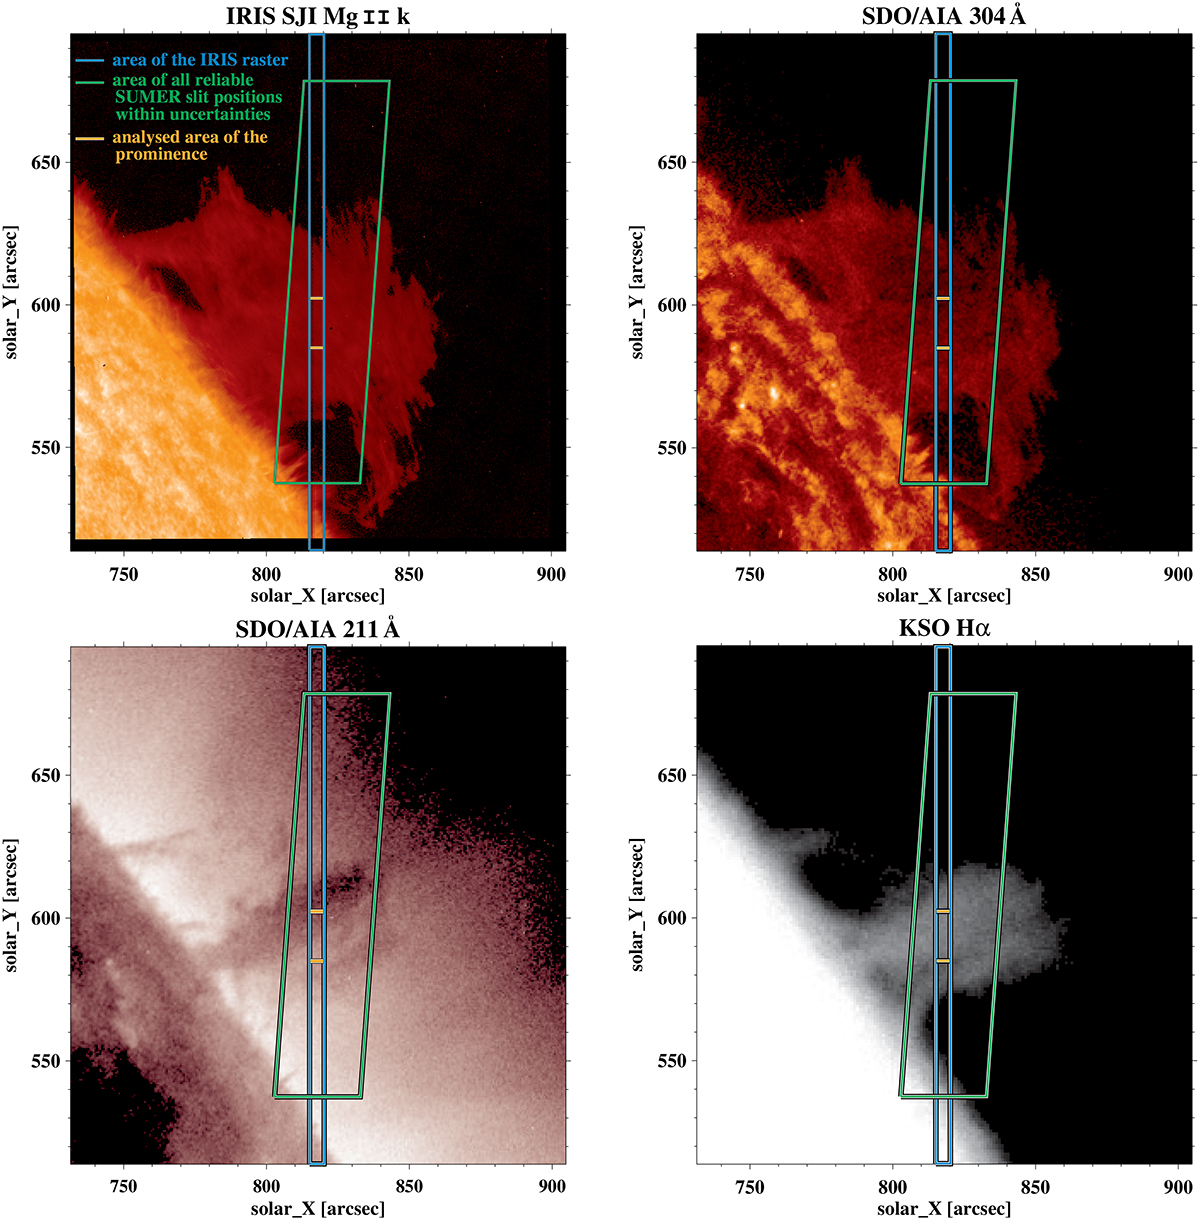
IRIS Mg II SJ image recorded at 08:40:16 UT (upper left panel) co-aligned by default with the AIA 304 Å channel image obtained at 08:40:19 UT (upper right panel). In the lower left panel is the AIA 211 Å channel image from 08:40:12 UT and in the lower right panel is the KSO Hα filtergram recorded at 07:32:01 UT; both these images are co-aligned with the IRIS observations. Structures visible in the Hα line resemble well the darkest absorption features present in the AIA 211 Å image. The IRIS FOV, the area of possible SUMER slit occurrence within uncertainties, and the analyzed area of the prominence – that is the section along the solar_Y, from which data were taken for the analysis – are marked in all four images.
Current usage metrics show cumulative count of Article Views (full-text article views including HTML views, PDF and ePub downloads, according to the available data) and Abstracts Views on Vision4Press platform.
Data correspond to usage on the plateform after 2015. The current usage metrics is available 48-96 hours after online publication and is updated daily on week days.
Initial download of the metrics may take a while.