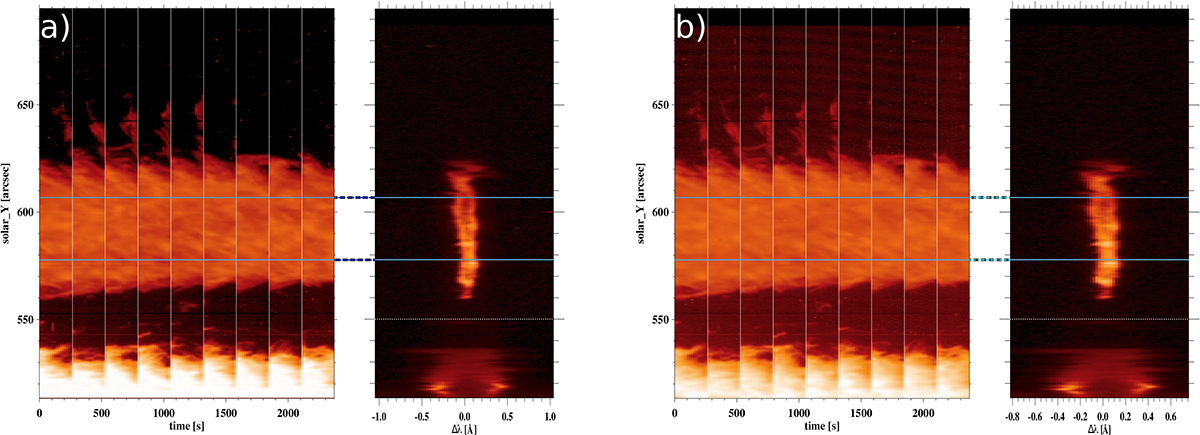
Fig. 3.
Download original image
Integrated intensities and examples of spectra of Mg II k (a) and Mg II h (b) from the first nine rasters taken into account for the analysis. Time runs from the beginning of the first raster made at 08:40:00 UT. The wavelength scales Δλ are relative to the line center wavelengths λ0 (Table 1). The blue horizontal lines indicate the section from which line profiles were taken into the analysis. In order to achieve a sufficient visibility of both Mg II spectral lines in the spectra at the disk edge, limb and prominence, specific intensities for solar_Y below 550 arcsec (white dotted horizontal line) were decreased by the factor of 0.3.
Current usage metrics show cumulative count of Article Views (full-text article views including HTML views, PDF and ePub downloads, according to the available data) and Abstracts Views on Vision4Press platform.
Data correspond to usage on the plateform after 2015. The current usage metrics is available 48-96 hours after online publication and is updated daily on week days.
Initial download of the metrics may take a while.