Fig. 2.
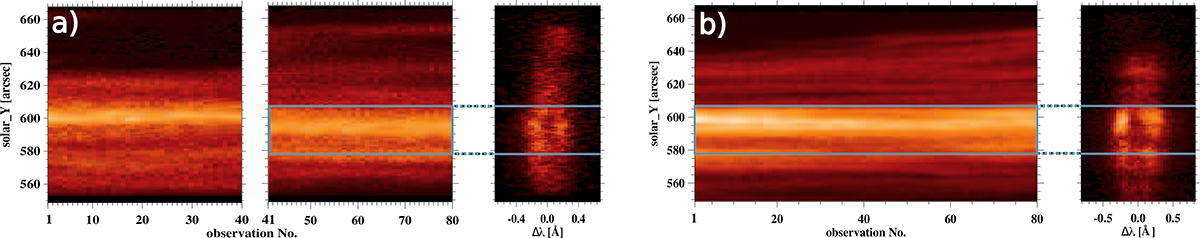
Download original image
Maps of integrated intensities of the Lyβ (a) and Lyα (b) S&S observations of the SUMER spectrograph (left part of each panel). The abscissas show the observation numbers counted from the beginning of the observations of a given spectral line (see observation No. 1 in Table 2). In panel a, both Lyβ blocks of observations are put together, even though they did not follow one after the other, to show that the pointing of the instrument differs between them. The right part of each panel shows an example of the observed spectra of the Lyβ and Lyα lines; the relative wavelength scale according to the laboratory central wavelength (Table 1) is indicated. The horizontal blue lines mark the part along the slit from which the data were taken for the analysis. As for Lyβ, these lines occur only in the latter block of the Lyβ observations (the block of No. 5 observations, see Table 2) because the pointing was not correct during the first block of observations.
Current usage metrics show cumulative count of Article Views (full-text article views including HTML views, PDF and ePub downloads, according to the available data) and Abstracts Views on Vision4Press platform.
Data correspond to usage on the plateform after 2015. The current usage metrics is available 48-96 hours after online publication and is updated daily on week days.
Initial download of the metrics may take a while.