Fig. A.3.
Download original image
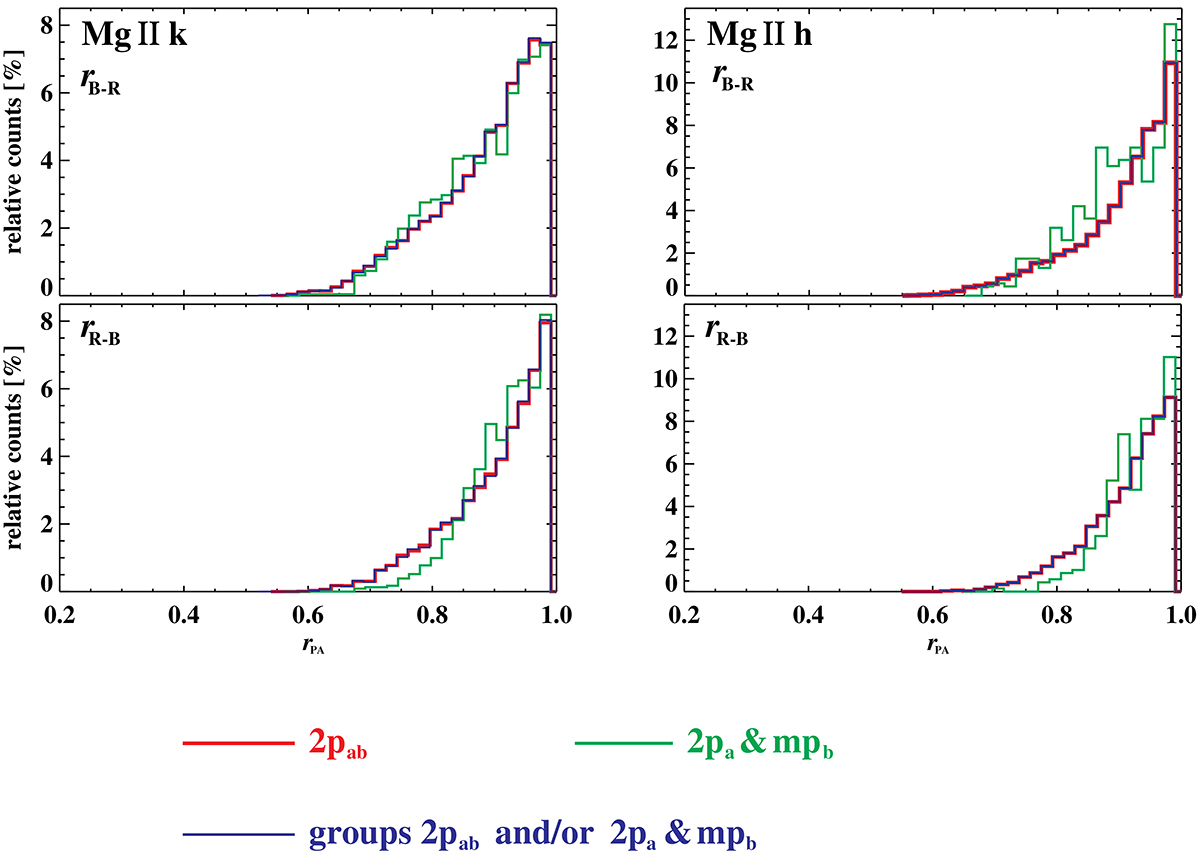
Histograms of the peak asymmetry (rPA) of the Lyα–Lyδ and Mg II k and h lines. Individual histograms are constructed for profiles with dominating red peak (denoted with label rB − R) and dominating blue peak (rR − B). For all six lines, histograms for three cases are plotted with lines of different colors: Those constructed for profiles from the group 2pab with red, for profiles from the group 2pa & mpb with green line. For a combination of profiles from both these groups, the histograms are plotted with the blue line.
Current usage metrics show cumulative count of Article Views (full-text article views including HTML views, PDF and ePub downloads, according to the available data) and Abstracts Views on Vision4Press platform.
Data correspond to usage on the plateform after 2015. The current usage metrics is available 48-96 hours after online publication and is updated daily on week days.
Initial download of the metrics may take a while.